Obcervant
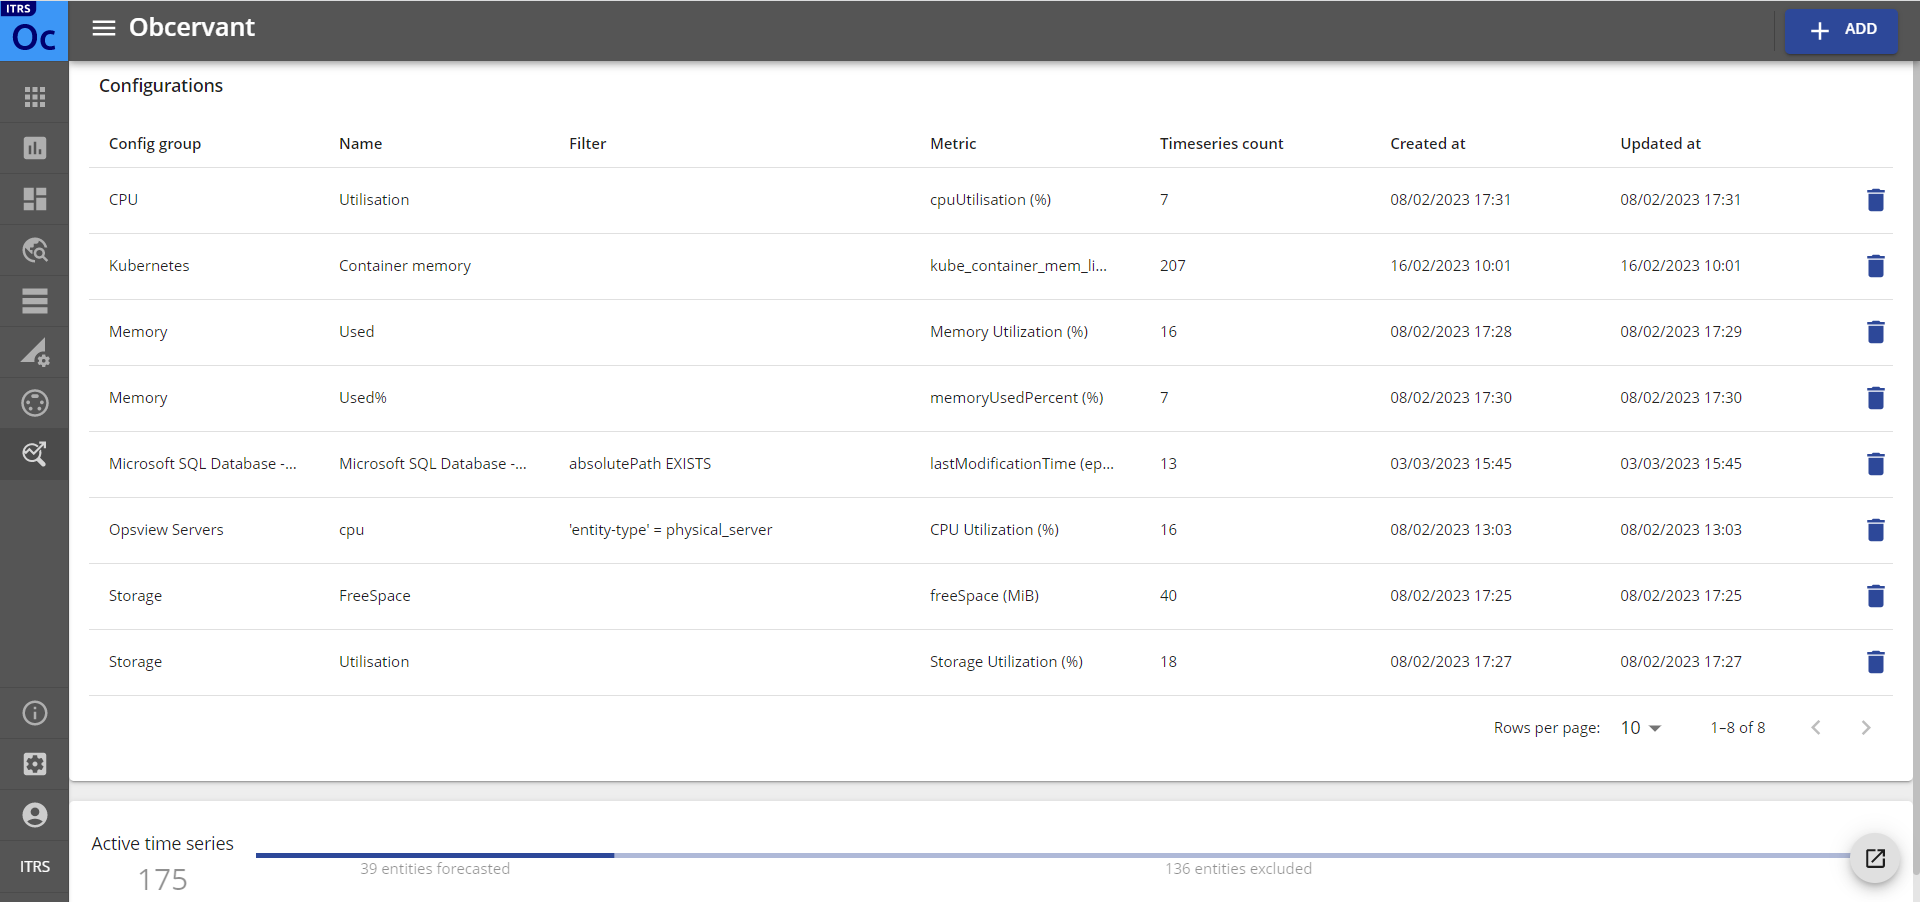
When you access Obcervant on the Web Console, you will see the Configurations page that displays all Forecaster configs.

Add a configuration Copied
To create a new configuration, follow these steps:
- On the Obcervant page, click Add.
- Under Config, choose a set of servers and a metric on which forecasts should apply.
Note
You cannot use the same name for the Config group and Name to define a forecaster config. Once a config is saved, Config group, Name and Metric cannot be modified.
You can select which entities to forecast and subsequent signal generation to include on the Filter field. Note that the metric type must be GAUGE or UNDEFINED. Negative values are not supported.
-
Under Model, choose the lookback period to define the amount of data to be used for the forecast.
The lookback period defines the granularity of data interval for historical data. By default, the bucket interval is calculated automatically. Generally, a longer lookback period means a bigger bucket interval. For example, if the lookback period is 4 weeks, the bucket interval will be 30 minutes. On the other hand, if the lookback period is 1 week, the bucket interval will be 10 minutes.
In some cases, forecast accuracy can be improved by overriding the default setting. To do this, you can select an option from the Bucket interval drop down menu. The options shown are based on the selected lookback period, which ensures that no unnecessary and excessive amount of data are requested.

Note
A maximum of 4 weeks (28 days) is allowed for the lookback period.
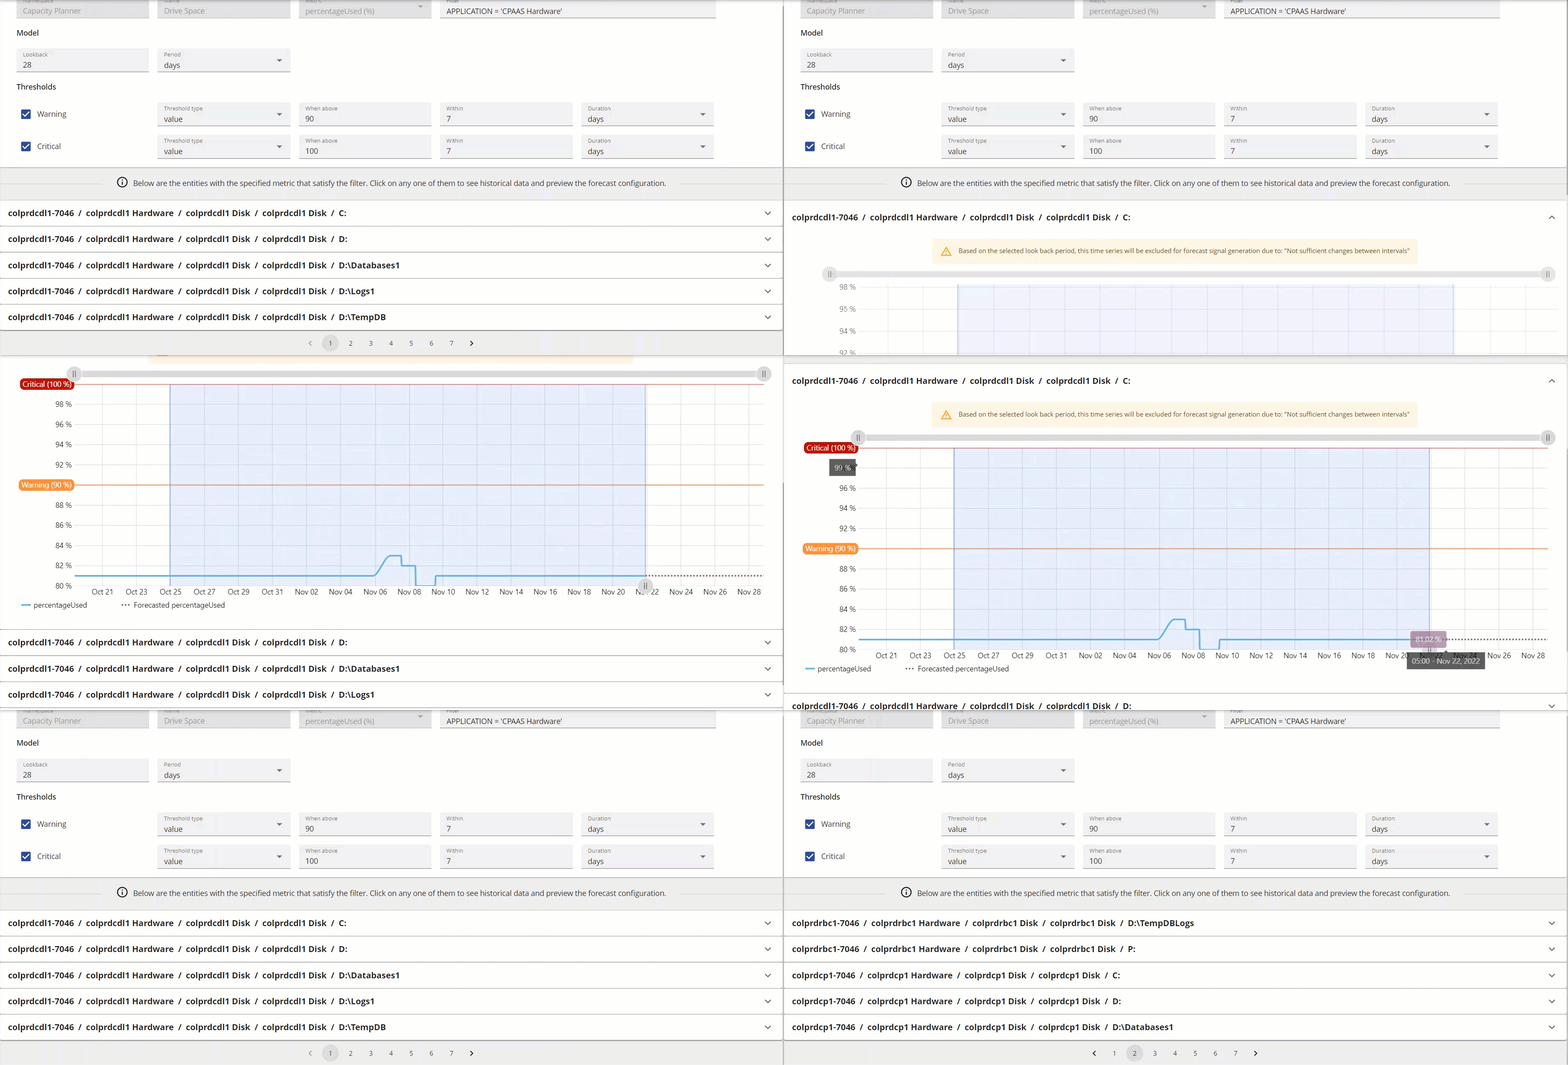
It is important that you set the lookback period correctly. The Forecaster app requires enough historical data to detect patterns. The examples below illustrates that the Forecaster predicts the trend accurately when the lookback period is set to 28 days, but failed to capture the trend if the lookback period is set to only 14 days.


However, more historical data do not always guarantee a more accurate forecast since it may also result in incorrect forecasts. This is due to the granularity of data interval used in the lookback period.
It is useful to set the lookback period on a case by case basis. The following example illustrates such case, where the Forecaster produces a much better result on a 12-hour look back period, compared with the one using 12-day lookback period.


-
Select which options to apply in Thresholds, and then specify your settings.
Click the Generate Signals toggle to choose between generating signals when forecasted usage or current usage breaches the defined threshold within a specified duration (which can be
>=or<=depending on the selection).Currently, these types of threshold are supported:
- Value — a static threshold.
- Metric — a dynamic threshold that is defined by another metric. This means that the threshold can change at real-time.

The Within parameter determines when to report a breach and create a signal. If the metric or value is forecasted to exceed the threshold within this timeframe, a forecast signal is generated.
For example, if the Within parameter is set to 6 hours and a forecast is made at 10 a.m., a signal will be triggered if the predicted breach time is at 1 p.m. However, if the forecast was made at 5 a.m. and the predicted breach time is 1 p.m., no signal will be generated because the breach time exceeds the 6-hour window.
-
Click Save.
You’ll see a list of entities that match the created filter. You can:
- Expand or collapse the forecast for each entity by clicking on its row.
- Page through the entities by clicking the arrows or numbers at the bottom of the screen.

Note
Admins can save or delete configs, while end-users can edit but not save configs.
Forecast charts Copied
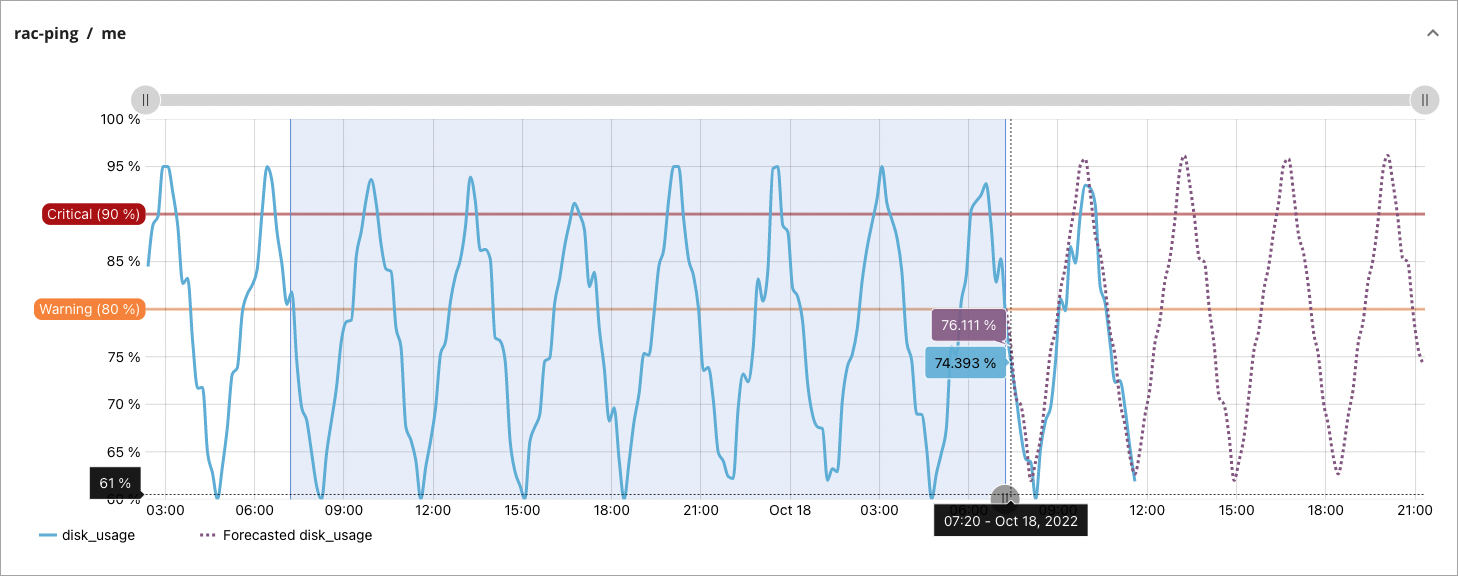
When you click an entity on a config page, you will see a forecast chart. The lines in the chart indicate the following:
- Solid blue line — the metric data.
- Dotted purple line — the forecast data.
- Solid red line — the critical threshold.
- Solid orange line — the warning threshold.

You can also check the historical data selected within the lookback period. The forecast start time is by default the current time. You can set the forecast start time back in the past for “what-if” analysis, which can be useful to:
- Check a visual examination of forecast accuracy.
- Retrospectively understand why a forecast signal was generated or cleared in the past.
To do this, drag the Pause button at the bottom of the chart. The example below shows a “historical” forecast where the forecast start time is set in the past, and part of forecast overlaps with the actual metric data.

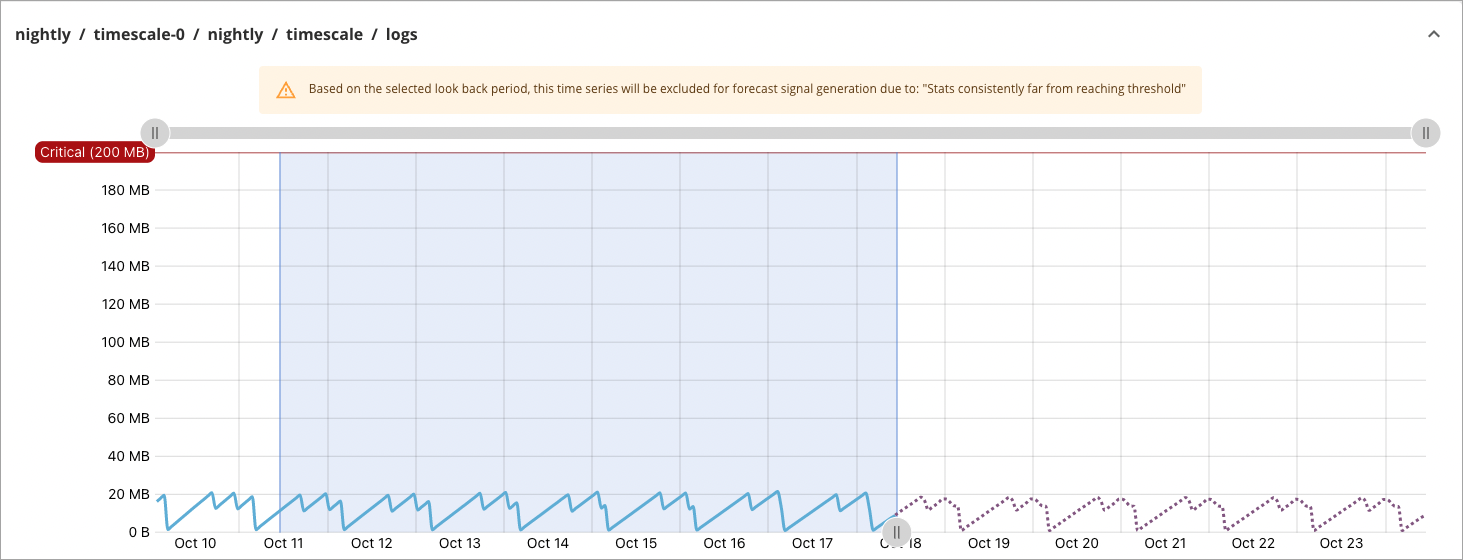
The Preprocessor may exclude entities to be forecasted. On the config preview, however, a forecast can still be viewed. The reason why it will be excluded for forecasting is provided on top of the chart, such as in the example below.

Note
If you change the lookback period or any thresholds settings, the Forecast chart will refresh automatically.