Web Dashboard
Introduction Copied
Geneos Web Dashboard is a client/server web application that allows Active Dashboards to be published and viewed over the web. Existing Active Dashboards can be deployed to a centralised location and viewed remotely without requiring the installation of Active Console.
With Web Dashboard, you are able to:
- Deploy a dashboard previously created in Active Console inside a web server.
- Access that dashboard from the web browser and see updates coming from Geneos.
- Navigate around and monitor multiple dashboards from the same web server.
- Access and execute data item commands for which the user has permission.
- Access external web pages if such links are defined within the dashboard contents.
The following diagram describes the application:
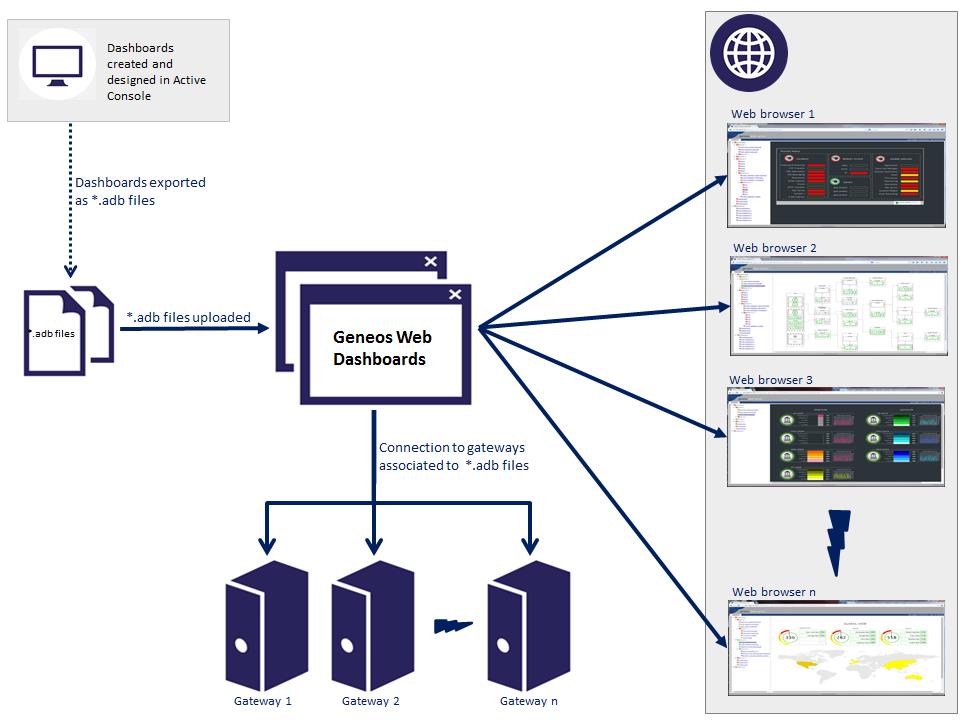
The server side deploys dashboards created with Active Console and renders them suitable to be seen through a web browser. It also establishes connections to Geneos Gateways to feed Geneos data to dashboards.
The client side communicates with the server to display and interact with deployed dashboards in a web browser.
User interface Copied
The user interface is accessed using a web browser.
There are two main sections that can be accessed via the following URLs:
- Display and navigation of dashboards and slideshows:
http://<web-dashboard-host>:<web-dashboard-port>/
- Configuration of connections, dashboards and slideshows:
http://<web-dashboard-host>:<web-dashboard-port>/#Config:
Dashboard navigation Copied
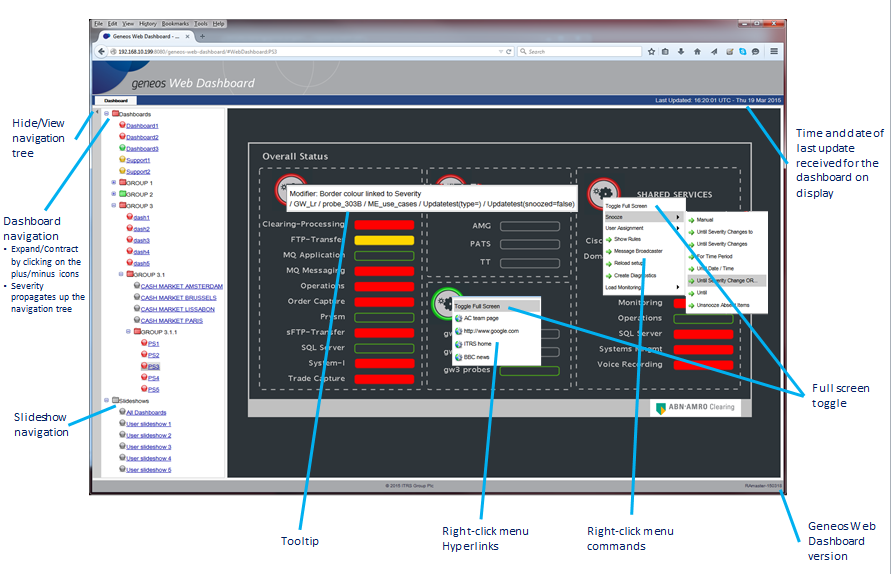
This user interface allows the navigation through the dashboards that have been uploaded in Web Dashboard and have been configured to appear in the navigation tree.
The navigation tree also allows viewing the slideshows if they have been configured.
The following picture shows the navigation page.
Dashboard configuration Copied
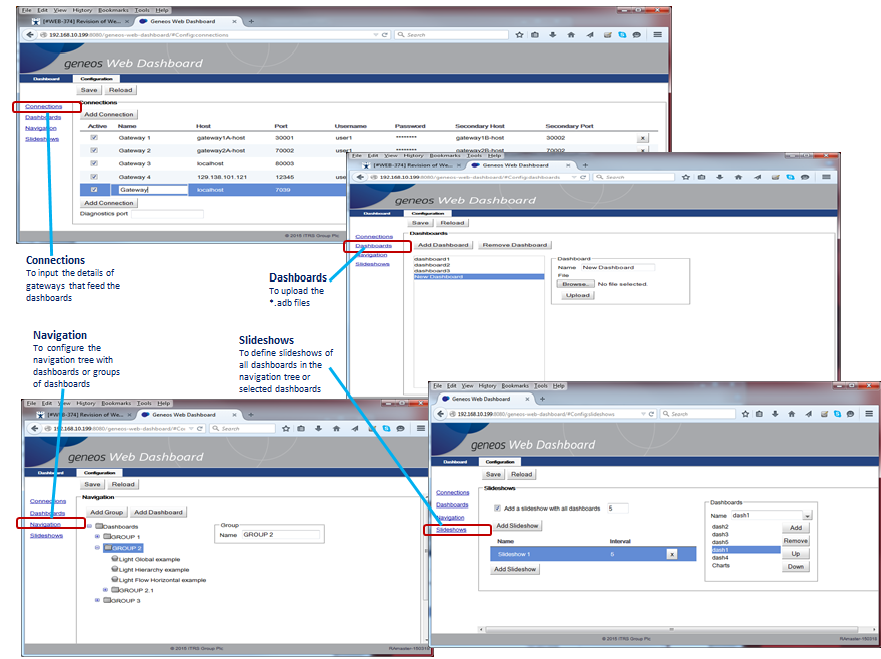
This user interface is required to add/remove dashboards in Web Dashboard, configure the navigation tree, and define slideshows and connections.
The following picture shows the configuration pages.
System requirements Copied
Web Dashboard is a 64-bit application on Linux, with the following system requirements:
Web Dashboard requires libnsl.so.1 library in order to run the application properly on Red Hat Enterprise Linux (RHEL) 8.
Note
Other OS distributions may work with the correct libraries installed but are not officially supported. For x86-64 distributions, the required 32-bit libraries must be available on the system. Also, other web browsers may work but are not officially supported.
Warning
Beginning Geneos version 5.0.0, this component is only compatible with other Geneos components that are version 3.6.0 or higher. For more information, see the Geneos Compatibility Matrix.
When Security-Enhanced Linux (SELinux) is running in Enforcing mode, it may deny certain functions of Geneos depending on the implemented configurations and policies.
To see which functions SELinux denies, check the audit log. The log is typically located in /var/log/audit.log, where the log type entry is AVC. The audit log provides the details of any denied access. For example, denied connection to the TCP port.
If you experience issues related to this mode, you may opt to disable SELinux, or create policy modules to grant the required access. Please contact your administrator or security team for assistance.
| Prerequisite | Minimum requirement |
|---|---|
| CPU | Multi-core CPU |
| RAM | 4 GB |
| Network | 1 network interface card |
| Disk | 500 MB available space |
Install the Web Dashboard Copied
There are two ways to install the Web Dashboard:
- Using extracted binaries
- Using Helm — refer to Web Dashboard deployments for more information.
To install the Web Dashboard using the binaries, follow these steps:
- Download the binaries at Downloads.
- Extract the binary to a writable location in the host. This will become the installation directory.
- Open the Web Dashboard. See Starting the Web Dashboard for different run options.
Take note of the host name or IP address of the server hosting the Web Dashboard and the port number since these are applied in the URL used to access it.
The default port number is 8080. If required, edit the GWS_PORT variable either in run or geneosws start-up script to change the port number.
Fontconfig dependency Copied
The Web Dashboard is packaged with the default font in order to run properly on Linux. You must install the fontconfig and run the following command:
sudo yum install fontconfig
Web Dashboard will not work properly without the installed fontconfig. If the fontconfig package is not installed in the system, Web Dashboard will display this error message in the logs: [ERROR] The dependency 'fontconfig' does not exist in the system. Please install this before running web-server.
Beginning Geneos 5.7.x, Web Dashboard uses Open Sans as its default font that is located in /resources/fonts where the new font files are stored. If you want to use a different font, take note of the following:
-
Only the
.ttfor.ttcfile formats are allowed to be used in the Web Dashboard. If a font file is not supported, Web Dashboard will display a warning message.- TTC files are a collection of one or more fonts. Only one font from this will be registered.
-
Any font files added in this directory will be registered when you run the Web Dashboard and those fonts can be used by the dashboards that are already uploaded in the system. If a font file is registered, Web Dashboard will display this information message in the logs:
2021-03-29 07:57:08 WebAppServer [INFO] Registered font Open Sans. -
If the
fontconfigfolder is deleted, Web Dashboard will display this warning message in the logs:[WARN] Fonts directory /home/ec2-user/testfix/resources/resources/fonts/ does not exist. Fonts in this folder will not be registered".
If an uploaded dashboard is using fonts that do not exist in the system, Web Dashboard will display a warning message and the default font will replace the non-existing font.
Upgrading Web Dashboard Copied
Note
The steps below are for Web Dashboard users upgrading from versions 3.0.x.
- Make sure that Web Dashboard is not running.
- Extract the new Web Dashboard binary to a new folder.
- Copy
config.xmland the.adbfiles from the old Web Dashboard directory into the new<web\_dashboard\_install\_dir>/configand<web\_dashboard\_install\_dir>/dashboards/uploadeddirectories respectively. - Edit
config.xmland make sure that the paths defined for each dashboard item are pointing correctly to the new Web Dashboard directory.
<dashboards>
<dashboard name="SampleDashboard" path="<web_dashboard_install_dir>/dashboards/uploaded/SampleDashboard.adb"/>
</dashboards>
- Start Web Dashboard.
Starting Web Dashboard Copied
The first time Web Dashboard is started:
- The minimal template file
config.xml.min.tmplis automatically renamed toconfig.xmland used as minimal configuration by the server. - A
Logsfolder is created in the installation directory with the fileWebDashboard.log.{date}.
Running start scripts Copied
Note
JRE 17.x 64-bit is required. For binaries packaged without JRE,JAVA_HOMEenvironment variable should be set on the machine.
There are two scripts in the installation directory to start Web Dashboard:
run— starts Web Dashboard in the foreground and produces a standard output as well as a log file. This is the default mode, and the script can be run in all supported operating systems.
./run
geneosws— starts Web Dashboard in the background as a service with the output sent to a log file. This script can only be run in Linux Red Hat or CentOS operating systems.
The following additional configuration must be done in order for the script to work:
- Copy the
geneoswsscript into the system’s/etc/init.ddirectory. - Set the appropriate run level. For example, in CentOS, it is:
chkconfig --level 345 geneosws on
- Specify the user that will start the service by editing the
USERNAMEvariable. This user must have administrative authorization to run the service. - Change the base directory by editing the
SCRIPTPATHvariable from “.” to the installation directory. By default, thegeneoswsscript assumes that the base directory is the current directory.
The following commands are supported:
./geneosws {start|stop|status|try-restart|restart|force-reload|reload}
start— launches web server in the background.stop— kills web server process.status— checks if web server is running.reload/restart/force-reload/try-restart— restarts web server process.
Enabling MAX_THREADS Copied
You can change the maximum threads that Web Dashboard allows by enabling the MAX_THREADS parameter through the run and geneosws scripts. If the Web server experiences connection issues, you can adjust the max thread count and use a load balancer, which is capable of distributing network or application traffic across multiple servers.
By default, this setting is disabled. To enable this setting, include this parameter in the script:
MAX_THREADS="-maxThreads 254"
Default value: 254
Defining the VALID_HOST_HEADER Copied
The VALID_HOST_HEADER parameter defines what host header values are accepted by the Web Server. Configuring this parameter ensures that the Web Server validates the host header and processes requests for the correct domain, preventing potential security vulnerabilities.
The value of the VALID_HOST_HEADER parameter is in the form of a regex pattern. By default, its value is .*, which allows the Web Server to accept any sequence of characters.
To modify this parameter:
-
Open the
runor thegeneoswsstart up script. -
Uncomment the
VALID_HOST_HEADERline and define the desired regular expression pattern.-Dvalid.host.header=.*
Setting the DEFAULT_ROOT_CONTEXT_PATH Copied
The DEFAULT_ROOT_CONTEXT_PATH parameter defines the base URL path at which the Web Dashboard can be accessed. For example, if the root context path is set to /dashboard, then the Web Dashboard is accessible at <protocol>://<hostname>:<port>/dashboard.
By default, the root context path is /.
To modify this parameter:
-
Open the
runor thegeneoswsstart up script. -
Uncomment the
DEFAULT_ROOT_CONTEXT_PATHline and specify the desired root context path.DEFAULT_ROOT_CONTEXT_PATH="-Droot.context.path=/dashboard"
Note
- The value of the root context path parameter should start with a
/.- If single sign-on (SSO) is enabled, the
webdashboard.urlproperty in thesso.propertiesfile does not need to include the root context path.
Log masking Copied
Web Dashboard logging uses Log4j2 and log masking can be enabled.
On Linux and Unix systems, the run and no_jre/run scripts define an optional shell variable LOG_MASKING, and pass $LOG_MASKING on the java command line (after -Dlog4j2.configurationFile=...).
To enable masking:
- Open the
runorno_jre/runscript in the Web Dashboard installation directory. - Uncomment the line that sets
LOG_MASKINGto-Dgeneos.logMasking.rules=${SCRIPTPATH}/config/geneos-log-masking/log-masking-rules.yaml, or update the path to point to your own rules file.
On Windows:
- Open
run.batorno_jre/run.bat. - Uncomment the following line, or update the path as needed:
set LOG_MASKING=-Dgeneos.logMasking.rules=config\geneos-log-masking\log-masking-rules.yaml
The java command already includes %LOG_MASKING%.
If you start Web Dashboard using the geneosws service script instead of run, add the same -Dgeneos.logMasking.rules=... JVM option to the java command in that script, or replicate the LOG_MASKING configuration used in run.
Setting the DASHBOARDS_EXTRACT_DIR Copied
The DASHBOARDS_EXTRACT_DIR parameter defines a specific folder where the contents of the Active Dashboard files (.adb) are extracted for conversion into Web Dashboards. This is enabled by default and is recommended especially if you are running multiple servers on the same machine.
To modify this parameter:
-
Open the
runor thegeneoswsstart up script. -
Locate the
DASHBOARDS_EXTRACT_DIRline and specify the desired folder path.DASHBOARDS_EXTRACT_DIR="-Dcom.itrsgroup.dashboard.extract=${SCRIPTPATH}/extract"
Caution
If this setting is disabled, all.adbfiles will be extracted to the default.geneosfolder. This may cause newer dashboard files to overwrite existing ones, preventing dashboards from displaying properly.
Enabling LOG_USERS_ACCESS Copied
The LOG_USERS_ACCESS parameter enables dashboard access tracking by logging user dashboard access at the INFO level. This parameter is disabled by default.
To enable this parameter:
-
Open the
runor thegeneoswsstart up script. -
Uncomment the
LOG_USERS_ACCESSline.LOG_USERS_ACCESS="-Dcom.itrsgroup.dashboard.user.logging=true"
Logs will be generated in this format:
YYYY-MM-DD HH:MM:SS.sss DashboardAccessLogger [INFO] User '<username> (<ip address>)' accessed dashboard '<dashboard name>'
The IP address is displayed only when no authentication is configured or when basic authentication is used. Below are some log examples:
- No authentication configured
2025-09-15 14:51:14.478 DashboardAccessLogger [INFO] User 'anonymousUser (192.168.100.78)' accessed dashboard 'INFRA_DASHBOARD'
- Using basic authentication
2025-09-15 14:51:14.478 DashboardAccessLogger [INFO] User 'admin (192.168.100.78)' accessed dashboard 'System_Status'
- Using SSO authentication
2025-09-15 14:51:14.478 DashboardAccessLogger [INFO] User 'LDN\johndoe' accessed dashboard 'Database Monitoring'
When both basic authentication and SSO are enabled, logs will follow the format used for SSO authentication.
Note
This parameter uses Log4j logging. Setting the log level to WARN or higher will prevent user access logs from being displayed, even when logging is enabled.
Enabling authentication Copied
Note
Always clear browser cache and cookies when switching between authenticated and unauthenticated versions of Web Dashboard.
Note
Single Sign On (SSO) must be disabled when enabling Authentication.
- Go to
<web\_dashboard\_install\_dir>/configdirectory. - Edit
security.xml. Comment out:
<intercept-url pattern="/**" access="permitAll" />
In XML documents, follow this syntax to comment out: “” and uncomment the following:
<intercept-url pattern="/**" access="isAuthenticated()" />
<authentication-provider>
    <password-encoder hash="bcrypt"/>
    <user-service properties="file:./config/users.properties"/>
</authentication-provider>
- Edit
users.properties. Follow the syntax indicated in the file to add users. To generate an encrypted password, run the following command at the<web\_dashboard\_install\_dir>directory:
java -cp 'jars/*:jars/geneos-bcrypt-hasher-1.0.jar' com.itrsgroup.login.auth.BCryptPasswordHasher <password to encrypt>
Enabling SSO Copied
If Single-Sign-On (SSO) is enabled, the SSO Agent verifies your user permission. After verifying your user credentials, the Web Dashboard checks your user’s group to grant the appropriate access.
For more information, see Enable SSO with Web Dashboard.
Note
Authentication must be disabled when enabling SSO.
Connect to SSO Agent through Kerberos Copied
Web Dashboard supports Basic and Kerberos authentication. When you are connecting to SSO Agent through Kerberos, Web Dashboard looks for the krb5.conf in /etc/ directory by default.
If you want to modify its location:
- Open
run/geneoswsstart-up scripts. - Edit the config under
SSO_PROPERTIES:
-Djava.security.krb5.conf=/etc/krb5.conf
Connect to SSO Agent through basic authentication Copied
When you log in for the first time, your browser will automatically save your credentials in the cache. Clear the browser cache to change the current user.
SSO configuration properties Copied
To edit the SSO configuration properties:
- Go to your
<web_dashboard_install_dir>/configdirectory. - Edit
sso.properties.
These are the SSO properties that you may need to configure when connecting to SSO Agent:
SSO public keys Copied
The SSO provider’s public key is used by Web Dashboard as part of the SSO authentication process. If using SSO Agent, copy the Agent’s pub.key file to a directory accessible to Web Dashboard. If using Gateway Hub or ITRS Analytics, copy the public key from the administrator UI to a file accessible to Web Dashboard.
If the file containing the public key is not in the working directory of Web Dashboard, the sso.pubkey property must include the file path as well as its name.
The key must be in PEM format, with lines no longer than 76 characters. For example:
-----BEGIN PUBLIC KEY----
MIIBIjANBgkqhkiG9w0BAQEFAAOCAQ8AMIIBCgKCAQEA9KTR6IFL44UTGCs5Hi2xfISO7eMBaqf7
5BQym/E8woQE2NOocyAvshGLAaE9oHP4vqRnc+hHyDs7DDF2u0VFcYp6r4uISe+HUka+wKjfSZZF
OB5lFYzZfb7hRGvc5kMZEvg7QYBej/c37uSB9r1/T4yao3SAdHGEwlthTKf0V+TtDGvlWPKGzVdC
YowmNC0Z1RxsT/X3jhNvnkHRQYXWhwGiEKU1+U7Bgtlpzd/3UFQnZsOIMFME9R53b+Wjron04B6O
BB0jqmWFTYaoXWh2oZBK5XZ1e165HaNXAYkeC4RcHdu8M0urk8JkkRby9M8UXxCATbVrtYGosoI9
JH+t1wIDAQAB
-----END PUBLIC KEY-----
The public key used to sign ITRS Analytics JWTs can be obtained from the auth/realms/obcerv endpoint provided by ITRS Analytics. This produces a JSON file that looks like:
{"realm":"obcerv","public_key":"MIIBIjANBgkqhkiG9w0BAQEFAAOCAQ8AMIIBCgKCAQEAs+MoswQTYc+J0MhLhzprJTb8U0MAd4f1X+txv9j653tsIGTsyV0ufJpsvTMk+kt/7XI1RNGuJ9IqrYenRnN1h65C6xb1ehJ0f8BCYLL+lv084RR5T7bcxAIKOEr6TUQmKSIE2uqi0EZg0MyGhAkEcDjrf7YqPPTiMCffOx+T9/yPo/wLcSluP2VdESkU0R91D9d2KGv0LmzWFLHRN9Ag70EWokM4Cw+/zi32ZqQEGlTA1G7YyEM+FlbrYPSYiBe1toCJ3fKJE1xvrp7+kj4imxWd5l0ljs/233DCcBVEM46UJ5cupTptZfTGnP/9NbrYySMpT6wga5eK2y28AdOFJQIDAQAB","token-service":"https://cconfig-playground.itrslab.com/auth/realms/obcerv/protocol/openid-connect","account-service":"https://cconfig-playground.itrslab.com/auth/realms/obcerv/account","tokens-not-before":0}
The key needs to be line-wrapped with the added PEM Public key header and footer using the following bash script:
#!/bin/bash
obcerv_url=$1
echo "-----BEGIN PUBLIC KEY-----"
curl -s -k ${obcerv_url}/auth/realms/obcerv | jq -r .public_key | fold -w 40 -
echo "-----END PUBLIC KEY-----"
Access for user groups Copied
To allow global access for config.user.groups and dashboard.user.groups, use a wildcard (*) as follows:
dashboard.user.groups=*config.user.groups=GENEOS-ADMIN*
A pattern is used to check if the user group roles are authorised. For example, if GENEOS_ADMIN_USER:
| Pattern | Description |
|---|---|
| Starts with GENEOS*, GEN*, G* | Groups are authorised because they start with the correct pattern. |
| Starts with Geneos* | Group is not authorised because the validation is case sensitive. |
| Starts with ADMIN* | Group is not authorised because the user group does not start with ADMIN. |
| Ends with *USER, *SER, *R | Groups are authorised because they start with the correct pattern. |
| Ends with *User | Group is not authorised because the validation is case sensitive. |
| In between *ADMIN*, *GENEOS*, *_USER* | Groups are authorised because this will find the pattern within the role whether it is in the beginning or the end. |
Access for Gateway Hub roles Copied
Beginning Geneos 5.7.x, the config.user.groups and dashboard.user.groups properties in the Web Dashboard can accept Gateway Hub roles for configuration and dashboard page access.
For more information about Gateway Hub roles, see Roles in the Web Console.
Access for ITRS Analytics roles Copied
Beginning Geneos 6.3.x, the config.user.groups and dashboard.user.groups properties in the Web Dashboard can accept ITRS Analytics roles for configuration and dashboard page access.
By default, ITRS Analytics is shipped with just two roles, admin and user. Additional roles can be configured using the integrated Keycloak UI.
| Property | Description |
|---|---|
sso.agent.url
|
Base URL for the SSO provider.
|
webdashboard.url
|
Web Dashboard URL and port. |
dashboard.user.groups
|
Comma-separated values that define the user groups or roles that are allowed to access the Dashboards and Slideshows sections of Web Dashboard. |
config.user.groups
|
Comma-separated values that define the user groups or roles that are allowed to access the Config section of Web Dashboard. |
sso.enabled
|
Determines whether SSO is enabled (true) or disabled (false). |
sso.pubkey
|
File containing the public key of the SSO provider. |
Enabling SSL Copied
Here are the steps to enable an SSL and scripts that you can use in the Web Dashboard.
Configure SSL certificates Copied
A script called ssl_util.sh exists in the installation directory which is used to generate or import a certificate.
There are two ways to configure an SSL certificate on the server:
Before you generate a self-signed certificate, you must update the following fields in the ssl_util.sh to ensure Web Dashboard can connect correctly to different components that also have SSL enabled such as SSO Agent:
Generate a new self-signed certificate Copied
To generate a new self-signed certificate:
- Run
./ssl_util.shfrom<web_dashboard_install_dir>directory. - Specify the host name or IP address of the box. This generates the certificate and add it to a keystore:
cd <web_dashboard_install_dir>./ssl_util.sh add <hostname_or_ip>
Success
A new certificate is now generated.
Import an existing certificate for your domain name Copied
If the server running Web Dashboard has an existing SSL certificate issued by a Certificate Authority (CA), you need to import that certificate and its private key into the server’s keystore.
- Convert your existing certificate and private key into
PKCS12format. Your certificate file needs to be called<hostname_or_ip>.cer.
cd <web_dashboard_install_dir>./ssl_util.sh convert <hostname_or_ip> <private_key_file>
- If your CA provides multiple intermediary certificates, you need to combine them into a single file using the command:
cat my_cert.cer intermediate1.cer intermediate2.cer > hostname_or_ip.cer
- Import the newly converted certificate using the command and specify the Export Password.
./ssl_util.sh import <hostname_or_ip> <export_password>
Success
The certificate is now imported.
Edit config files Copied
Edit <web_dashboard_install_dir>/config/security.properties. If changes were made to the value of KEYSTORE and PASSWD
in ssl\_util.sh, update the values of the properties below:
keyStore=config/keystore.db
trustStore=config/keystore.db
keyStorePassword=ab987c
trustStorePassword=ab987c
To change the port number to use for secure connection, update the property to 7743.
| Field | Description |
|---|---|
<web_dashboard_install_dir>
|
Web Dashboard installation directory. For example: WEB_DASHBOARD_INSTALL_DIR=<web_dashboard_install_dir> |
DNAME
|
Certificate information variables. Distinguished Name (
For example: CN=localhost.itrs.test, OU=Geneos, O=ITRS, L=Mountain View, ST=California, C=US The value of |
PASSWD
|
Password for your private key. Set the If you change the password, you should also update it in the |
keystore_type
|
By default, Web Dashboard sets the value of If you require Web Dashboard to have keys in |
Edit scripts Copied
These are the scripts that you can modify when configuring the SSL certificates.
Edit the run or geneosws script depending on the start-up mode to use. Uncomment this line:
#ENABLE_SSL="-ssl true"
Restart your Web Dashboard server and verify that the certificate is being used by opening the following page:
https://hostname\_or\_ip:port/. If you generated a self-signed SSL certificate, the browser warns you
that the certificate is not trusted. Add an exclusion rule (or continue).
Configuring Web Dashboard Copied
Type the host and the port of Web Dashboard in the web browser to access the configuration page in the following format:
http://<web-dashboard-host>:<web-dashboard-port>/#Config:
Example:
http://192.168.10.155:8080/#Config:
Adding Active Dashboards Copied
Dashboards need to be created in Active Console and exported as .adb files before they can be added to Web Dashboard.
The deployment of dashboards into Web Dashboard takes place in three steps:

Connecting to Gateways Copied
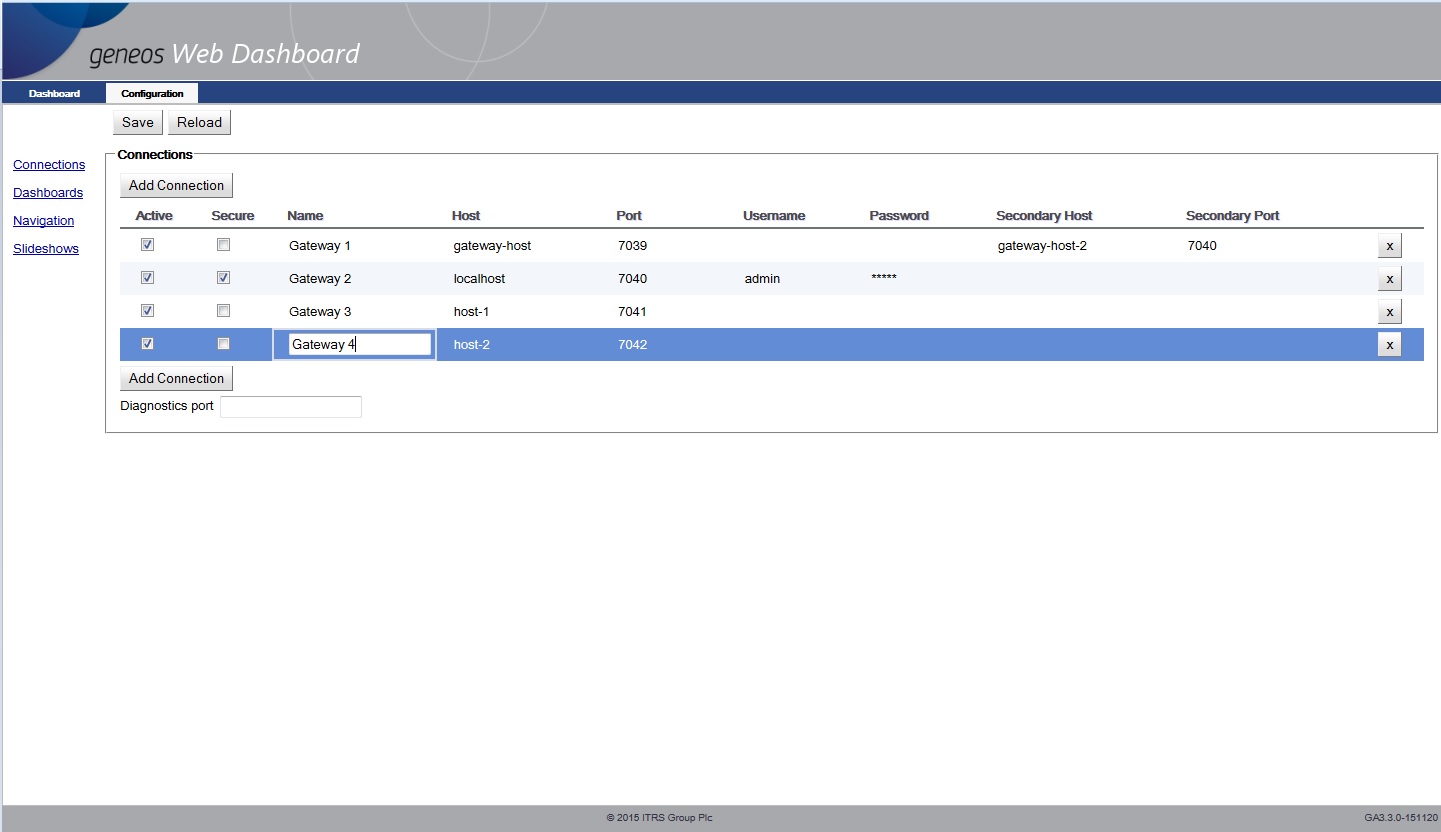
- Click on the “Add Connection” button to add a new Gateway connection.
- Edit the Gateway connection fields. If connecting to a secure Gateway, tick the “Secure” check box.
- Click on the “Save” button for Web Dashboard to establish the new Gateway connection and add it to
config.xml.
Encrypting and decrypting Gateway connection passwords Copied
Note
Older versions of theWeb Dashboard binary expose a secret key that can be used to decrypt the password of the Gateway connection. This will be retained for backward compatibility since an existing Gateway configuration cannot be decrypted without it.
Upon the start of the Web Dashboard, a new randomized secret key will be generated in the config folder called secretKey. This new key will be used to decrypt and encrypt new passwords. However,after saving the Web Dashboard setup, the Gateway connection password will only be encrypted with the new key.
Gateway connections in config.xml Copied
Each connection is defined by a <gatewayConnection> element with a name attribute. The connection has the following properties:
Example:
<geneosWebServer>
        <gatewayConnections>
                <gatewayConnection name="Gateway1">
                        <enabled>true</enabled>
                        <primary>
                                <host>gateway1A-host</host>
                                <port>30001</port>
                        </primary>
                        <secondary>
                                <host>gateway1B-host</host>
                                <port>30002</port>
                        </secondary>
                        <description>Gateway One</description>
                        <user>user1</user>
                        <password type="encrypted">AABBZZYYZZ</password>
                </gatewayConnection>
                <gatewayConnection name="Gateway3">
                        <enabled>true</enabled>
                        <secure>true</secure>
                        <primary>
                                <host>localhost</host>
                                <port>80003</port>
                        </primary>
                        <secondary>
                                <host/>
                                <port>0</port>
                        </secondary>
                        <description>Gateway Three</description>
                        <user>admin</user>
                        <password type="plain">MyPlainPassword</password>
    </gatewayConnection>
                <gatewayConnectionname="Gateway2">
                    <enabled>true</enabled>
                    <secure>true</secure>
                <primary>
                <host>gateway2A-host</host>
                        <port>80004</port>
                </primary>
                <secondary>
                        <host/>
                        <port>0</port>
                </secondary><description>Gateway Two</description>
                <sslEnabled>admin</sslEnabled>
                <user>admin</user>
                <passwordtype="plain"></password>
            </gatewayConnection>
        </gatewayConnections>
</geneosWebServer>
| Property | Mandatory | Description |
|---|---|---|
| <enabled> | Yes | Determines whether a connection is enabled or disabled. |
| <primary> | Yes | Contains the primary gateway’s host and port number defined in <host> and <port>. |
| <secondary> | No | Contains the secondary gateway’s host and port number defined in <host> and <port>. |
| <secure> | No | Determines whether a connection is secure or insecure. |
| <description> | No | The description of the Gateway. |
| <sslEnabled> | No | Determines whether a connection will use SSL connection or normal authentication (false). When this is enabled, the user property becomes mandatory and the password is no longer used. |
| <user> | No | Username to access the Gateway. |
| <password> | No |
Password to access the Gateway. The password has an attribute called type which could have the values “encrypted” or “plain”. This attribute is used to determine if the password is encrypted or not. By default, the type is “encrypted” if the Gateway connection has been entered through the configuration interface. |
SSL Certificate Authentication Copied
In addition to password authentication, a secure connection to a Gateway can be
established using an SSL Certificate. This authentication method can be enabled
by ticking the SSL column of a Gateway in the connections configuration page, or by
setting the Gateway’s sslEnabled property to true. An SSL certificate or key pair needs to be
added to the keystore and aliased ‘geneosAuthentication’ before the Web Server
is started.
Generating an SSL Certificate and Private Key pair Copied
To generate a public certificate and private key for Web Dashboard, see the
examples in Secure Communications. The process is the same as when generating
a certificate and private key for the Gateway or Netprobe. The certificate for
Web Dashboard should be named geneosAuthentication.cerand this should be generated by
the same Certificate Authority as the certificate issued for every Gateway Web Dashboard will connect to.
Connection between Web Dashboard and Gateway with an SSL enabled authentication Copied
You can configure the Web Dashboard so that it can connect to a Gateway with an SSL enabled authentication. If the Gateway is using an SSL authentication, then it may be using a certificate in PKCS12 format.
Before you generate your keystore, follow these steps:
- Edit the value of the
KEYSTORE_TYPEvariable in thessl_util.shtoPKCS12instead of the defaultJCEKS. Thekeystore.dbis generated after this. - Edit the
keyStoreTypeandtrustStoreTypevariable inconfig/security.propertiestoPKCS12. - You can now import the certificate to the keystore by using the sample command:
./ssl_util.sh import geneosAuthentication <password>
Adding a Certificate and Private Key to the keystore Copied
- Edit
<web_dashboard_install_dir>/ssl_utl.shand change the value ofKEYSTOREto point to the desired keystore file. The keystore password can be changed by modifying the value ofPASSWD.
KEYSTORE=${WEB_DASHBOARD_CONFIG_DIR}/keystore.db
- Convert your existing certificate and private key into
PKCS12format. The certificate needs to be calledgeneosAuthentication.cer.
cd <web_dashboard_install_dir>
/ssl_util.sh convert geneosAuthentication <private_key_file>
- The converted certificate needs to be imported to the keystore using the password specified when the certificate was converted.
./ssl_util.sh import geneosAuthentication <password>
- If
KEYSTOREorPASSWDhave been changed in:
<web_dashboard_install_dir>/ssl_utl.sh
- Then edit:
<web_dashboard_install_dir>/config/security.properties
- Update the values of the properties below accordingly:
keyStore=config/keystore.db
trustStore=config/keystore.db
keyStorePassword=ab987c
trustStorePassword=ab987c
Uploading .adb files Copied
When naming web dashboards, avoid using the following characters because it can cause an error to the displayed dashboard view:
- Ampersand (
&). - Plus (
+). - Double quotation marks (
"). - URL character codes, such as
'%20'or'%5C'.
To upload a new .adb file into the web dashboard, follow these steps:
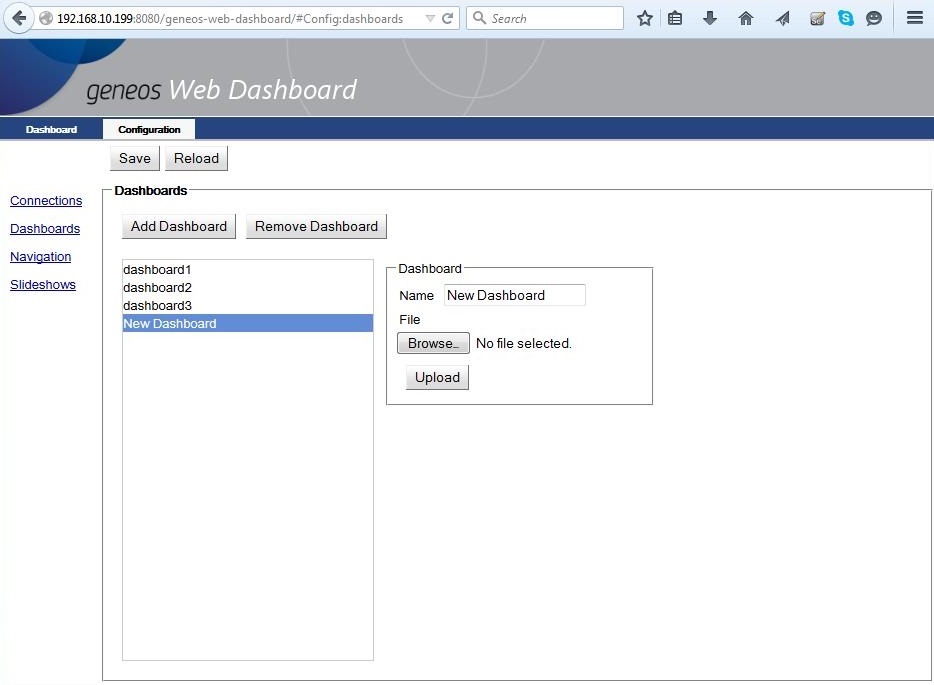
- Select Dashboards from the left-hand navigation list in order to deploy a dashboard.
- Click Add Dashboard. This shows the Dashboard dialog.
- In the dialog, type a name for the dashboard.
- Click Browse to locate the
.adbfile to upload. - Click Upload to make a copy of the
.adbfile in the dashboard folder. - Click Save for Web Dashboard to add the new dashboard to
config.xml.
Uploaded dashboards in config.xml Copied
Dashboard information is contained in the <dashboard> element in config.xml with the following attributes:
Example:
<geneosWebServer>
        <dashboards>
                <dashboard name="dashboard1" path="/path/to/dashboards/uploaded/dashboard1.adb"/>
                <dashboard name="dashboard2" path="/path/to/dashboards/uploaded/dashboard2.adb"/>
                <dashboard name="dashboard3" path="/path/to/dashboards/uploaded/dashboard3.adb"/>
                </dashboard>
        </dashboards>
</geneosWebServer>
When you get an error when loading .adb files, see When loading .adb files into older versions of Web Dashboard.
| Attribute | Description |
|---|---|
| name | The name given to the dashboard. |
| path |
The location where the By default, the path is |
Changing the default dashboards upload folder Copied
To change the default dashboard upload folder, edit the run script and the value of the DASHBOARDS_DIR parameter to the path of the chosen folder where the dashboard files are uploaded.
DASHBOARDS_DIR="-Dcom.itrsgroup.dashboard.dir=<Path to dashboards directory>"
For users who have as existing setup and would want to change their dashboard upload folder, the following steps have to be done:
- Manually update the dashboard paths in the config.xml file to point to the new dashboard upload folder.
- Copy all the dashboards (.adb) files from the old upload folder to the new one.
Remember to do the 2 steps when setting a new upload folder from an existing setup. Doing only step 2 will cause the dashboards copied to the new upload folder to be deleted.
Configuring the navigation tree Copied
Select Navigation from the left-hand navigation list in order to organise the tree of dashboards for viewing.
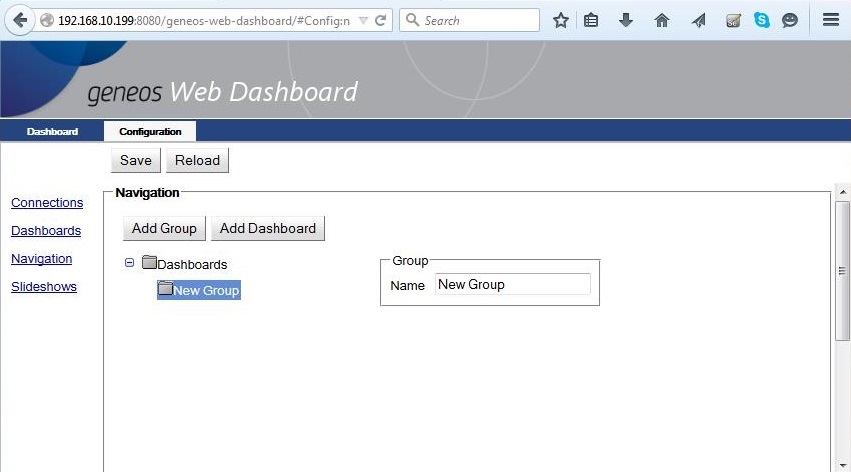
- Select Dashboards which is the top of the tree.
- Click on the “Add Group” button to add a group. This shows a dialog with a single field to type the name of the new group.
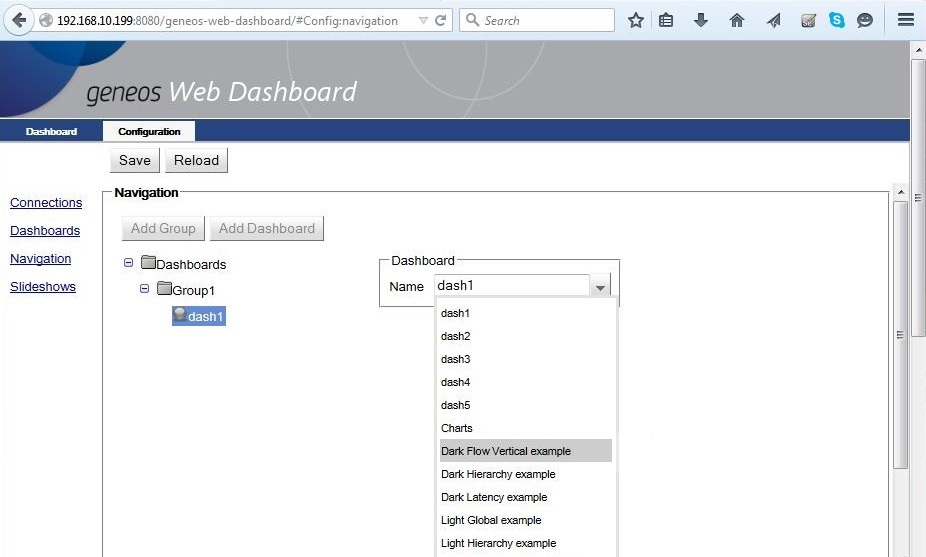
- Select a group and click on the “Add Dashboard” button to add a dashboard in the group. This shows a dialog with a dropdown menu of dashboards that have been uploaded by Web Dashboard.
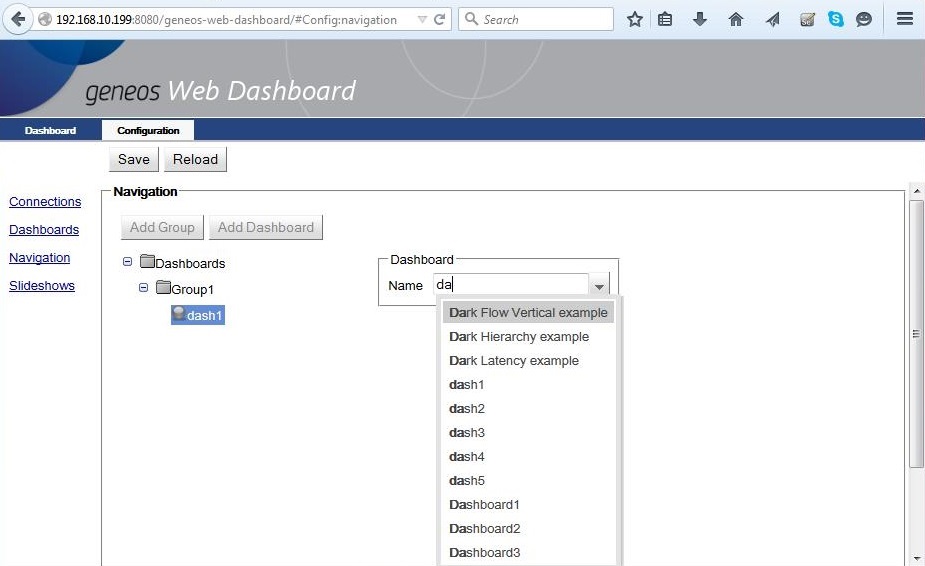
- Type in the first characters of a dashboard name filters the dropdown menu to the dashboard names that start with those characters.
- Continue creating new groups which can be populated with selected dashboards. A hierarchical order can be defined in the navigation tree by creating groups under groups.
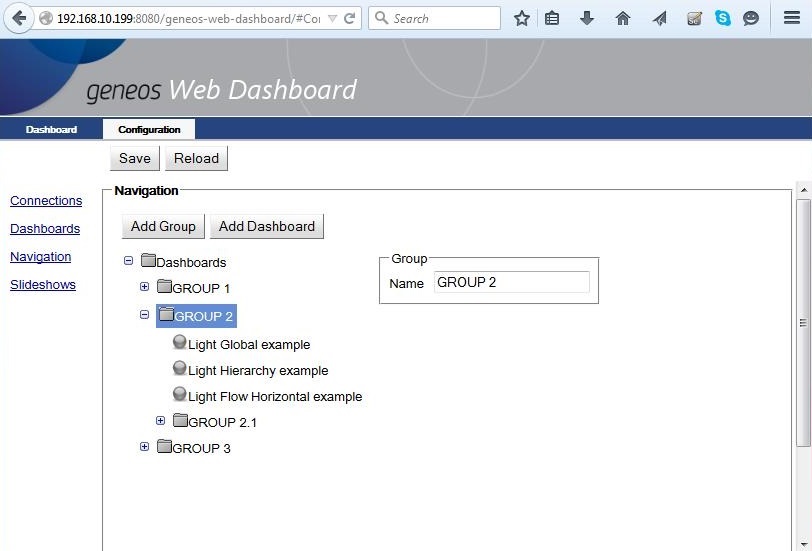
- Click on the “Save” button to save the configuration of the navigation tree in
config.xml. - Click on the Dashboard tab to check how the navigation will be seen by users.
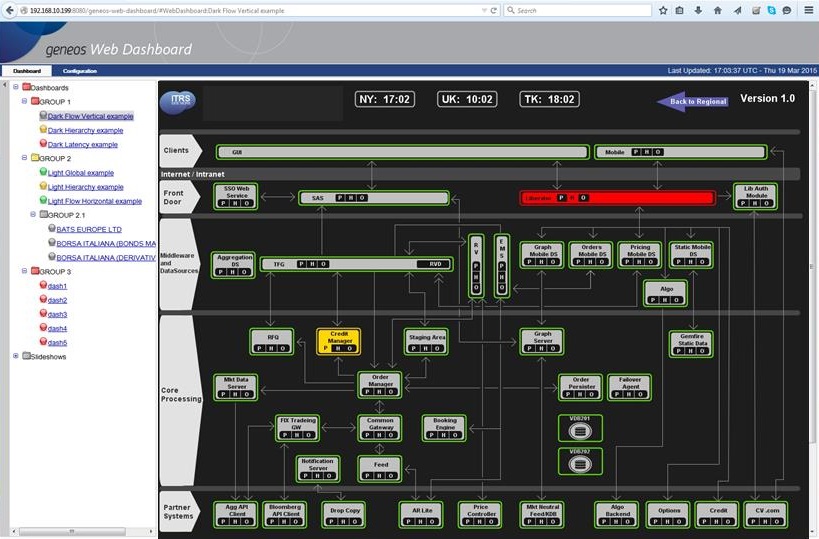
Navigation tree in config.xml Copied
The navigation tree is defined under the <tree> element with the following properties:
Example:
<geneosWebServer>
        <tree>
                <group name="GROUP 1">
                        <dashboard name="dashboard1A"/>
                        <dashboard name="Dashboard1B"/>
                </group>
                <group name="GROUP 2">
                        <dashboard name="dashboard2A"/>
                        <dashboard name="dashboard2B"/>
                        <dashboard name="dashboard2AC"/>
                        <group name="GROUP 2.1">
                                <dashboard name="dashboard2.1A"/>
                                <dashboard name="dashboard2.1B"/>
                        </group>
                </group>
                <group name="GROUP 3">
                        <dashboard name="dashboard3A"/>
                        <dashboard name="Dashboard3B"/>
                </group>
        </tree>
</geneosWebServer>
| Property | Mandatory? | Attribute | Description |
|---|---|---|---|
| <group> | No | name | A group contains one or more dashboards and could also contain another group. |
| <dashboard> | No | name | A dashboard is part of a group |
Defining slideshows Copied
Slideshows can be defined to view a set of dashboards or all dashboards, one after another at specified time intervals.
Select Slideshows from the left-hand navigation list in order to define a slideshow.
Web Dashboard can be configured to set:
- A single slideshow for all dashboards defined in the navigation tree
- Any number of user-defined slideshows to view selected dashboards in the navigation tree
Slideshow to display all dashboards in the navigation tree Copied
- Tick the “Add a slideshow with all dashboards” checkbox. This shows the interval time field.
- The default interval time is 5 seconds. If a longer interval is required, edit the interval time.
- Click on the “Save” button to save the slideshow in
config.xml.
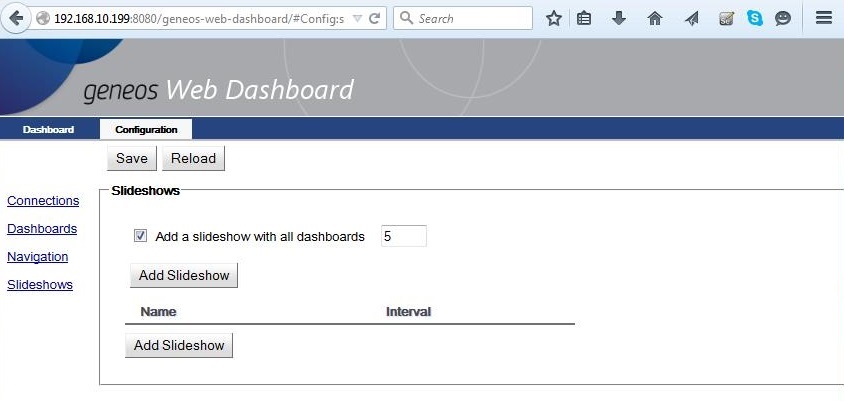
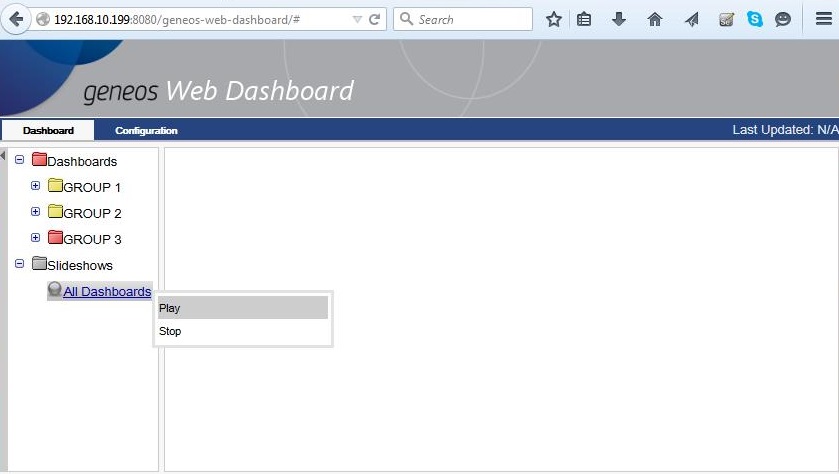
- Go to the Dashboard tab to check the “All Dashboards” slideshow.
Slideshow to display selected dashboards Copied
- Click on the “Add Slideshow” button to open a new slideshow row.
- Edit the name of the new slideshow. This shows the Dashboards dialog.
- The default interval time is 5 seconds. If a longer interval is required, edit the interval time.
- Click on the “Add” button in the Dashboards dialog. By default, the name of the first dashboard in the list appears. Click on the name to show the dropdown list of dashboards.
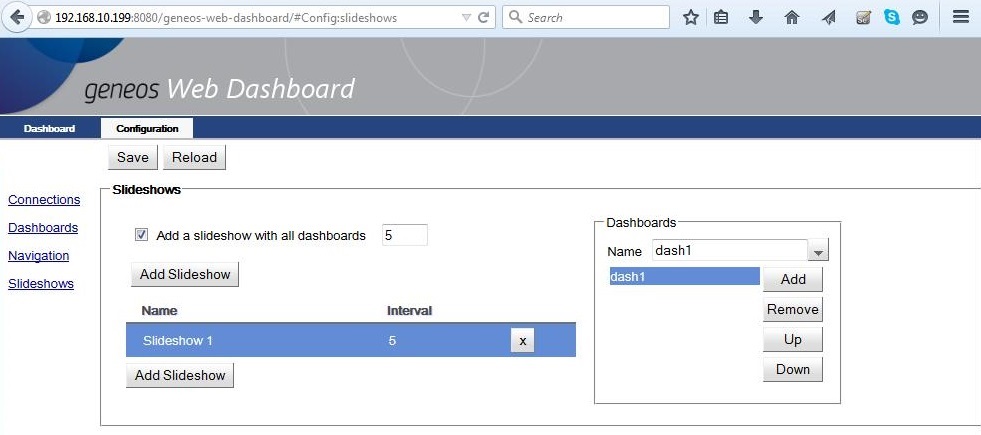
- Repeat step 4 to add more dashboards to this slideshow.
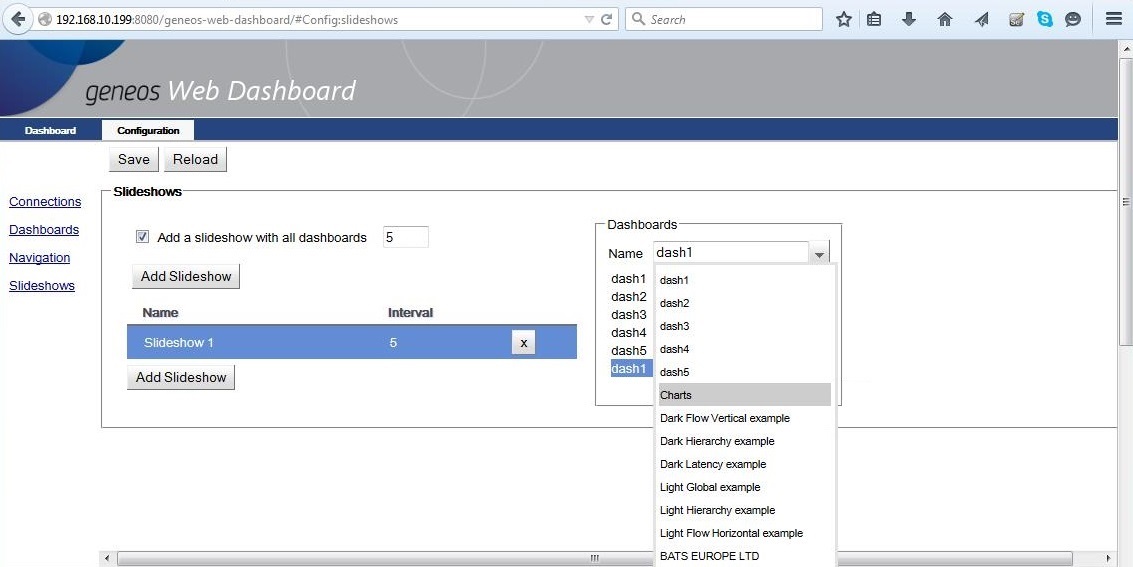
- The “Up” and “Down” buttons in the Dashboards dialog can be used to define the sequence of dashboards in the slideshow.
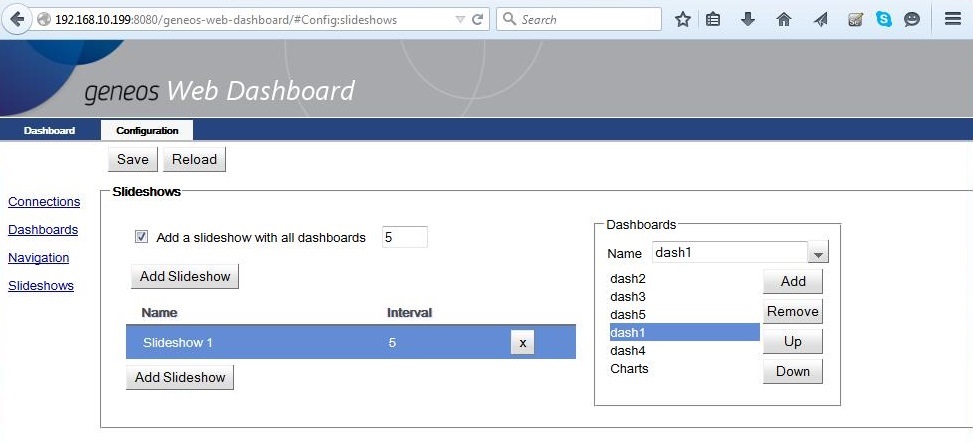
- The “Remove” button can be used to delete a dashboard from the slideshow.
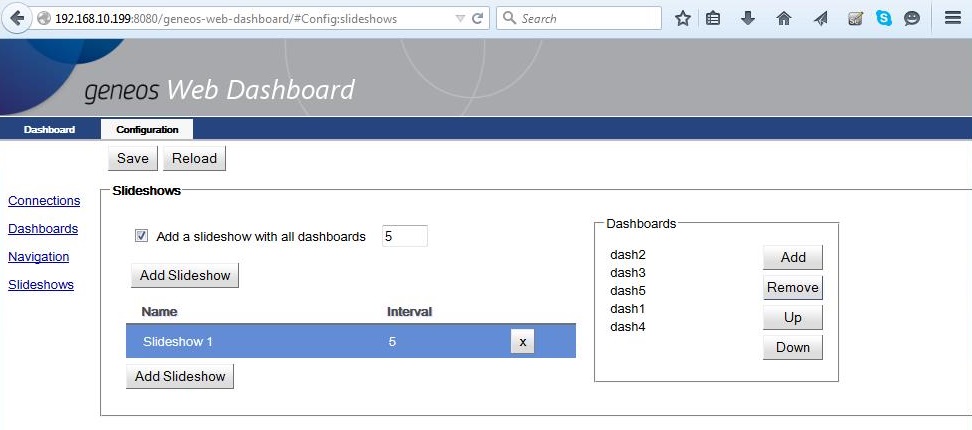
- Once the new slideshow configuration is completed, click on the “Save” button to save the new slideshow details
config.xml. - Go to the Dashboard tab to check the new slideshow.
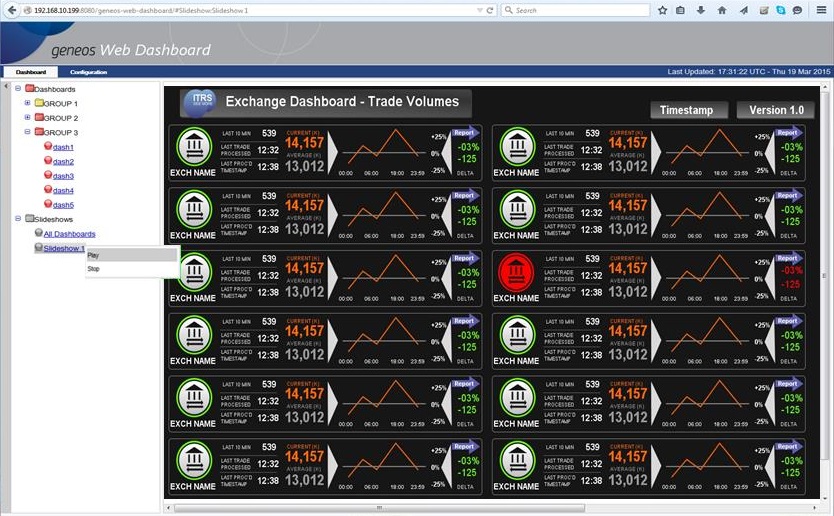
Slideshows in config.xml Copied
A slideshow is stored under the <slideshows> element with the following attributes:
And can contain one or more dashboards.
Example:
<geneosWebServer>
   <slideshows>
          <slideshow name="All Dashboards" interval="5"/>
          <slideshow name="Slideshow 1" interval="5">
                 <dashboard name="dashboard1"/>
                 <dashboard name="dashboard2"/>
                 <dashboard name="dashboard3"/>
                 <dashboard name="dashboard4"/></slideshows>
</geneosWebServer>
| Attribute | Description |
|---|---|
| name | The name given to the slideshow |
| interval |
The time in seconds taken by every dashboard in the slideshow to be on display. Default value: 5 seconds |
Settings for the visualisation of dashboards in browsers Copied
config.xml contains the <dashboardDefaults> element with the
settings applicable to all dashboards configured in Web Dashboard:
<geneosWebServer>
        <dashboardDefaults>
                <updateRate>5</updateRate>
                <dashboardRefreshRate>3</dashboardRefreshRate>
                <tileSize>
                        <width>200</width>
                        <height>200</height>
                </tileSize>
        </dashboardDefaults>
</geneosWebServer>
It is not recommended to change these settings but, if required, these changes need to be implemented with care. The following points need to be taken in consideration:
<updateRate>should be set equal or more than<dashboardRefreshRate>since clients are guaranteed not to receive an update until a dashboard refresh takes place.- Faster
<dashboardRefreshRate>makes dashboards appear more real-time but in turn increases CPU usage on the server and potentially increases network traffic as updates are being sent more frequently – this assumes<updateRate>is closely aligned to<dashboardRefreshRate>. - Tiling size allows for more granular control of how updates are processed on the server and sent over the network. Smaller values make more efficient use of network as clients download less redundant data but in turn makes many more requests. Also, CPU usage on the server may increase due to processing more granular updates and handling the increased number of requests.
Note
The settings tileCacheSize and tileCacheTime have been removed fromconfig.xml.
| Property | Attribute | Description |
|---|---|---|
| <updateRate> | Not applicable |
Sets the interval time at which the Web Dashboard client checks for updates to a dashboard. Once set, it determines the last updated timestamp between your internet browser and the Web Dashboard client. Default value: 5 seconds Note: Setting this value to |
| <dashboardRefreshRate> | Not applicable |
Sets the frequency at which the Web Dashboard server processes dashboard updates. Default value: 3 seconds |
| <tileSize> |
<width>
<height>
|
Sets the tile size to be used by Web Dashboard when rendering the dashboard image. Default value for both attributes: 200 pixels |
Delete dashboards in the Web Dashboard Copied
Removing dashboards from the configuration takes place following these steps in a precise sequence:

Remove the dashboard from a user-defined slideshow Copied
- Go to the Slideshows configuration page.
- Click on the user-defined slideshow. This shows the Dashboards dialog.
- Select the dashboard in the Dashboards dialog list and click on the “Remove” button.
- Click on the “Save” button so that Web Dashboard modifies the
<slideshows>element inconfig.xml.
Remove the dashboard from the navigation tree Copied
- Go to the Navigation configuration page.
- Locate the dashboard in the navigation tree and right-click on it.
- Select the “Remove” option.
- Click on the “Save” button so that Web Dashboard modifies the
<tree>element inconfig.xmland its internal dashboard handler program.
Delete the dashboard from the Web Dashboard Copied
- Go to the Dashboards configuration page.
- Click on the dashboard so that the “Remove Dashboard” button is activated.
- Click on the “Remove Dashboard” button.
- Click on the “Save” button so that Web Dashboard modifies the
<dashboards>elementconfig.xmland deletes the uploaded.adbfile in the installation directory.
Delete the Gateway connection if it only served the deleted dashboard Copied
- Go to the Connections configuration page.
- Locate the gateway and click on its “X” icon.
- Click on the “Save” button so that Web Dashboard modifies the
<gatewayConnections>element inconfig.xml.
Delete a slideshow in the Web Dashboard Copied
- Go to the Slideshows configuration page.
- Locate the slideshow and click on its “X” icon.
- Click on the “Save” button so that Web Dashboard modifies the
<slideshows>element inconfig.xml.
Delete unused dashboards Copied
Web Dashboard stores the uploaded and saved .adb files in the default dashboard directory, <web-server-location/dashboards/uploaded>, which you can change manually. When you have unused dashboards that are not defined in the config.xml file, Web Dashboard will automatically delete these unused dashboards by default.
You can disable the automatic file deletion of unused dashboards by setting the value of deleteUnusedDashboards property to false in the web-server/config/config.xml in your local machine.
However, when you disable the auto-deletion of unused dashboard files, this affects the behaviour of saving your changes in the Web Dashboard. For example, if you manually remove a dashboard in the Web Dashboard, and then you save the changes, its corresponding dashboard file will not be removed automatically from the dashboard directory. You must delete the file manually in order to completely remove it.
When upgrading to Web Dashboard 5.10.x, you have an option to immediately disable the auto-deletion of unused dashboards:
- Open the Web Server binaries on your local machine.
- Copy the existing
config.xmlfile from the previous version, and then paste it to the latestconfigdirectory. - Modify the configuration file, and then add the
deleteUnusedDashboardsproperty under thedashboardDefaults. - Set the value to
false.
<dashboardDefaults>
 <deleteUnusedDashboards>false</deleteUnusedDashboards>
</dashboardDefaults>
- Save your changes.
Alternatively, you can create a new configuration file from scratch, and change the value of the deleteUnusedDashboards property in the web-server/config/config.xml folder.
Working with the Web Dashboard navigation interface Copied
Opening the navigation interface Copied
Type the host and the port of Web Dashboard in the web browser to access the navigation interface in the following format:
http://<web-dashboard-host>:<web-dashboard-port>/
Example:
http://192.168.10.155:8080/
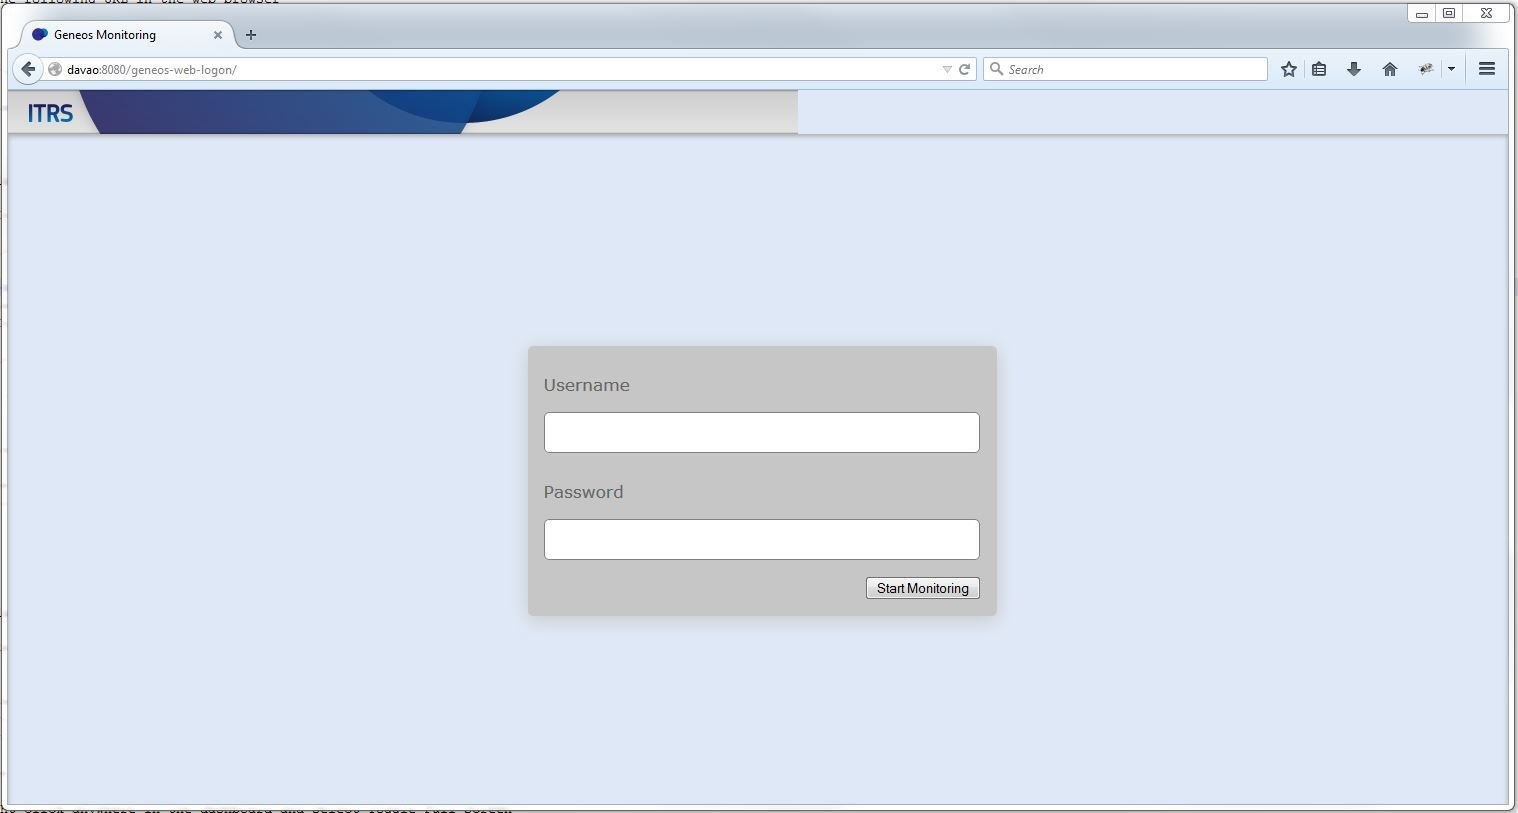
If authentication is enabled, the page displays a log-in screen. See Enabling Authentication in Starting Web Dashboard section to set up users.
Note
Username is case-insensitive.
If authentication is disabled or after a successful log-in, the page displays the navigation tree with 2 root entries: Dashboards and Slideshows. The Dashboards group expands to the first level if the navigation tree has been configured.
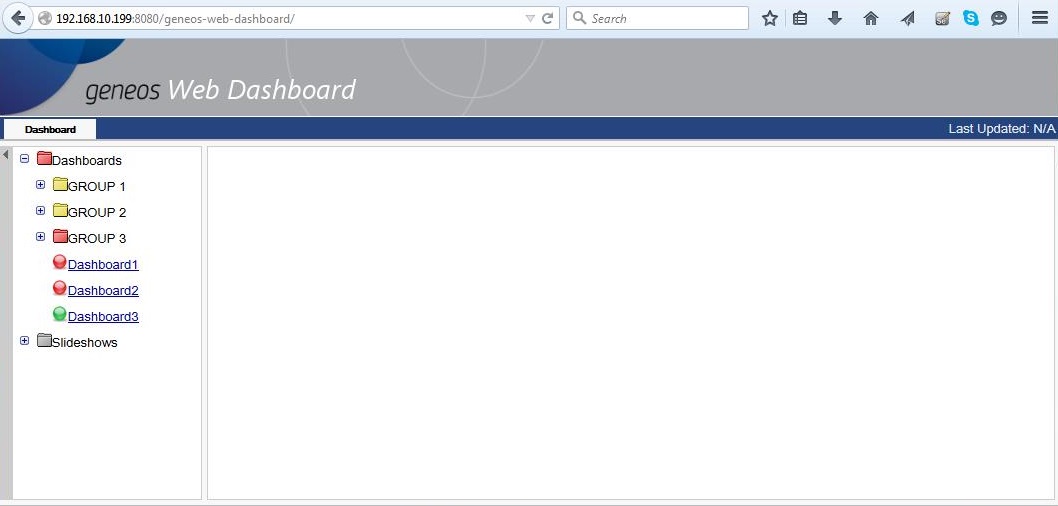
The Last Updated timestamp is the update between the user’s browser and the Web Dashboard client. For more information, see <updateRate> property in the Settings for the visualisation of dashboards in browsers.
Selecting a dashboard to view Copied
There are two ways to bring a dashboard to be displayed:
- Select the dashboard in the Dashboards navigation tree. This may require to expand a group in the tree by clicking the add button.
- Access the dashboard directly by adding
#WebDashboard:<dashboardname>to the basic URL. Example:
http://192.168.10.155:8080/#WebDashboard:Dashboard1
Maximizing the view of the dashboard Copied
By default, the dashboard on display occupies a pane beside the navigation tree and under the top banner.
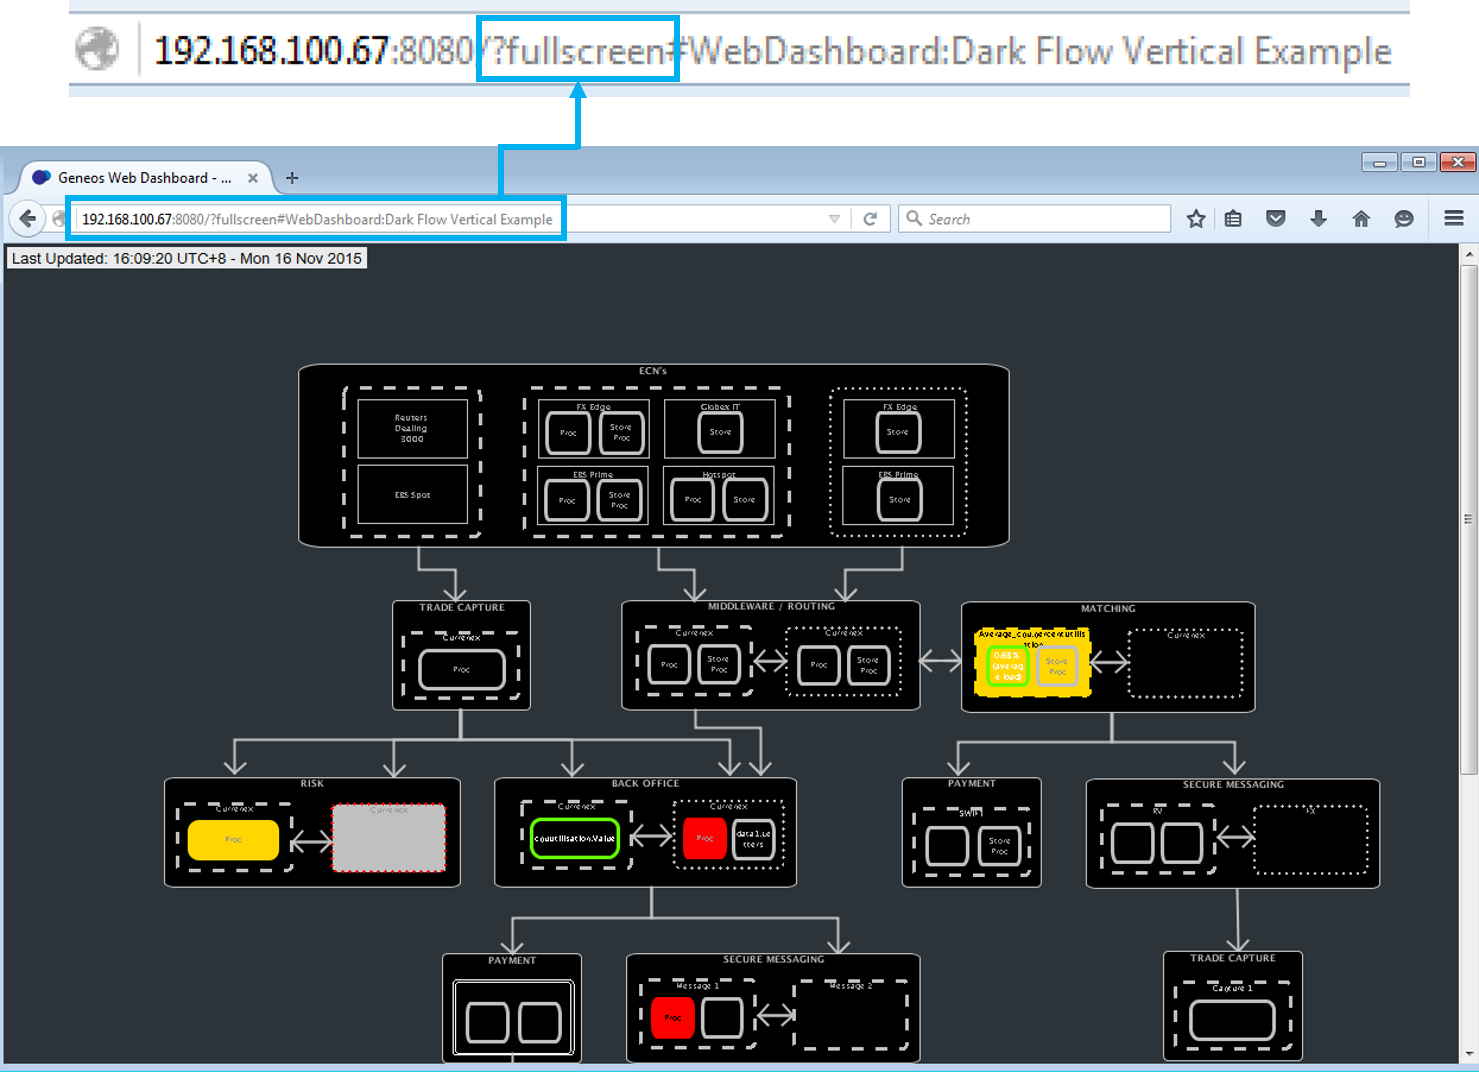
There are 2 ways to maximize the display of a dashboard:
- Right-click anywhere in the dashboard and select “Toggle Full Screen”.
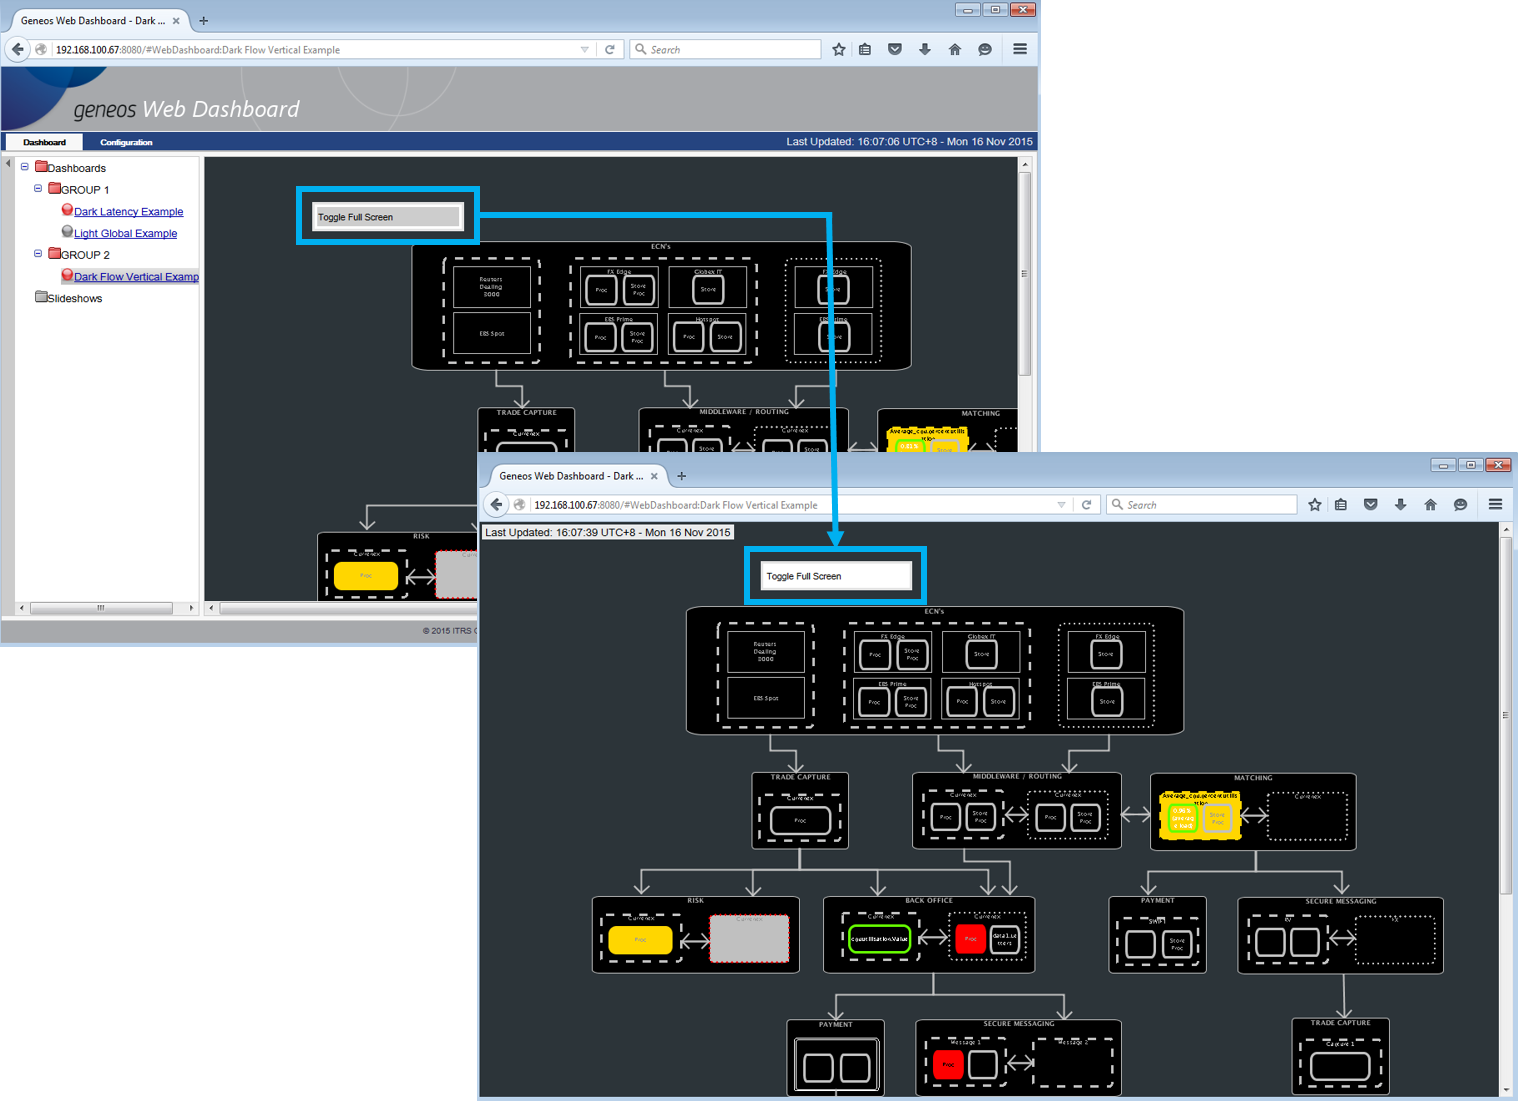
The same steps can be used to return to the normal view.
- Select the dashboard in the Dashboards navigation tree and add
?fullscreento the basic URL, e.g.,
http://192.168.10.155:8080/?fullscreen#WebDashboard:Dashboard1
Executing data item commands Copied
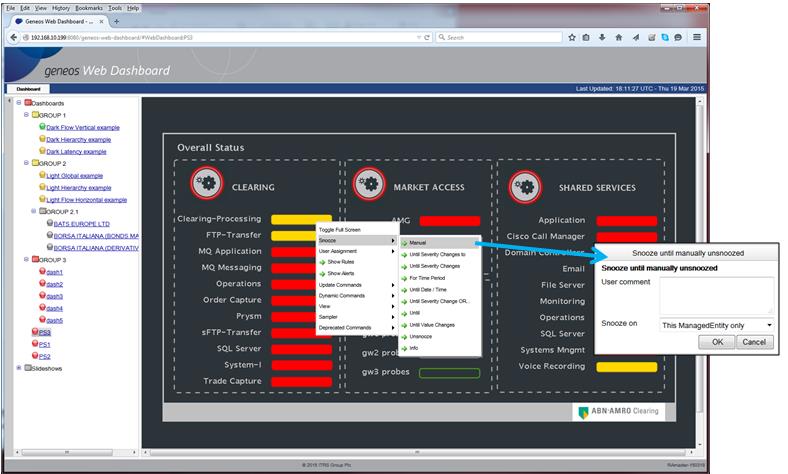
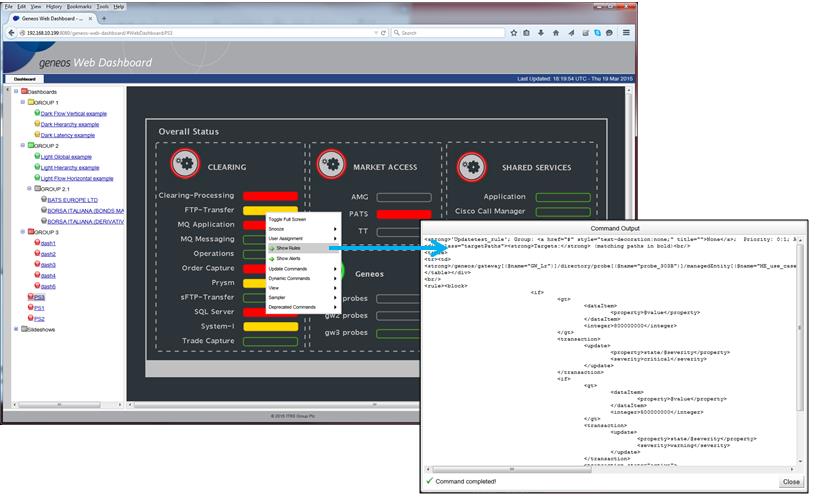
Right-click on a data item in the dashboard to access data item commands. This action prompts Web Dashboard to display a menu with the commands relevant to the data item.
If the selected command requires user input, the page displays a dialog for the user to fill in.
If the execution of the command results to an output, the page displays a command output dialog.
Executing hyperlinks Copied
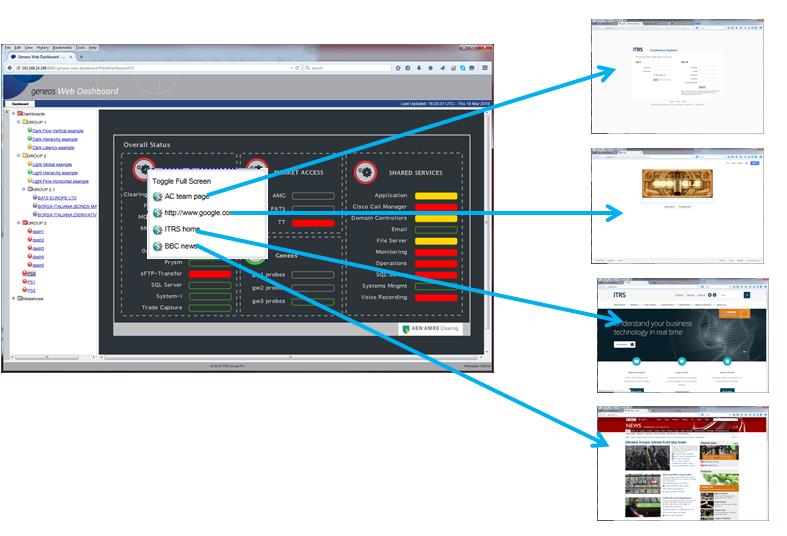
If hyperlinks have been defined in the dashboard, these can be accessed through the right-click menu of the data item. Select a link to open its page as a new tab in the browser.
Selecting a slideshow to view Copied
There are 3 ways to bring a slideshow to be displayed:
- Click on the slideshow in the Slideshows navigation tree.
- Right-click on the slideshow in the Slideshows navigation tree and select the “Play” option.
- Access the slideshow directly by adding
#Slideshow:<slideshowname>to the basic URL, e.g.,
http://192.168.10.155:8080/#Slideshow:User Slideshow 1
The slideshow displays the sequence of dashboards it was configured with. The time a dashboard remains in view is the time interval defined in the configuration of the slideshow.
Every dashboard in the slideshow that is displayed is highlighted in the Dashboards navigation tree. This allows the user to follow the order of the sequence.
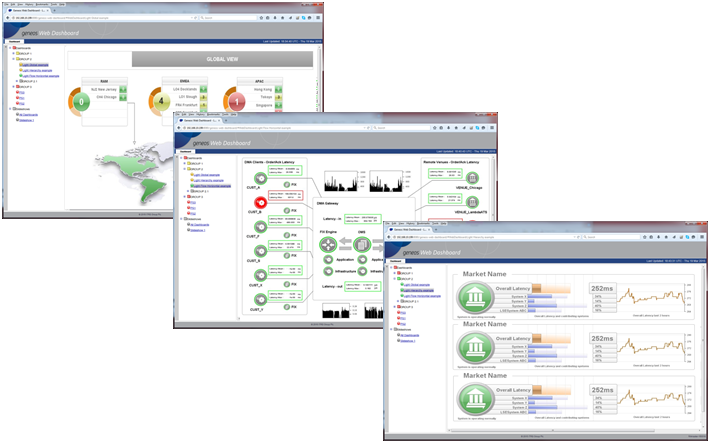
Stopping a slideshow Copied
There are 2 ways to stop a slideshow:
- Right-click on the slideshow in the navigation tree and select the “Stop” option.
- Select and click on any other dashboard in the navigation tree.
Troubleshooting Copied
When loading .adb files into older versions of Web Dashboard Copied
You cannot load .adb files in any versions of the Active Console or Web Dashboard that are older than the version used to create the file. To load the dashboard correctly, use a version of Active Console or Web Dashboard that is the same or a newer version than the version that was used to create the .adb file.
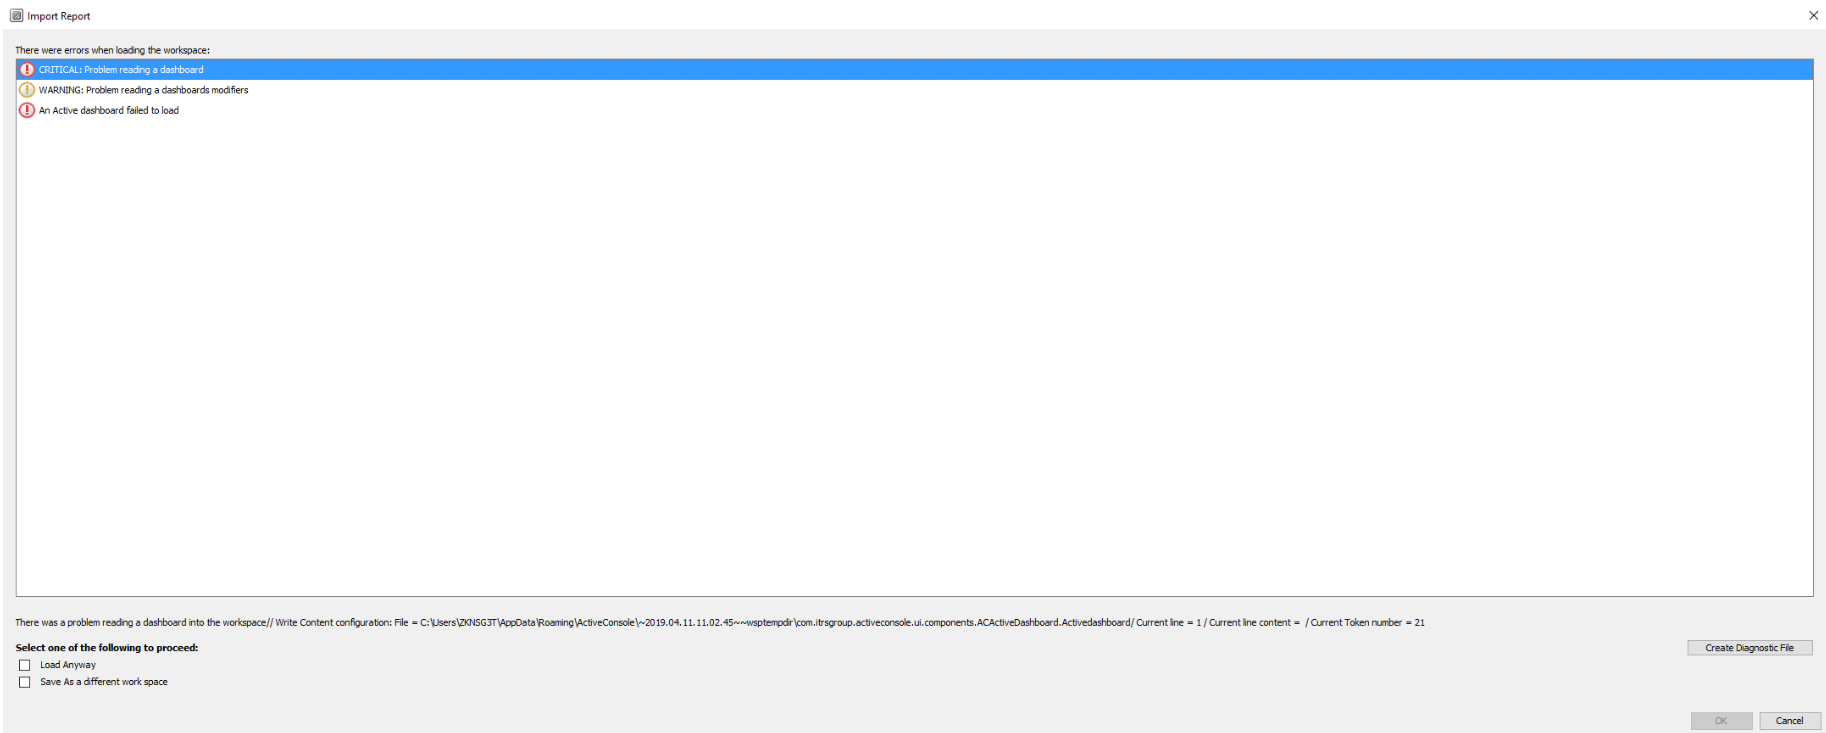
The following errors are displayed when loading or importing an .adb file created in a newer version of Active Console or Web Dashboard:
CRITICAL: Problem reading a dashboardWARNING: Problem reading a dashboards modifiersAn Active dashboard failed to load
The screenshot below shows these errors:
Increase the heap size to reduce memory issues in dashboards Copied
Memory issues can affect the system performance of your dashboards. Dashboards freezing or not responding can be due to a problem with the allotted memory or large number of XPaths used when loading dashboards. Also, check if OutOfMemoryException is present in the logs of your dashboards.
If you suspect memory or performance issues when processing or loading multiple dashboards, follow these recommendations:
- Use JMX plug-in to check the CPU and memory usage. This allows you to monitor the heap memory size and ensure it has not reached its allocated maximum. For more information, refer to Enable JMX port for remote monitoring.
- Increase the heap memory size. This can be done by manually editing the
geneoswsfile, located in the main directory of the web dashboard folder. Inside thegeneoswsfile is a variable namedGWS_RUN_CMD:
GWS_RUN_CMD="$JRE_BIN_PATH/java -XX:+UseConcMarkSweepGC -Xmx1024M -server $HEADLESS
The option -Xmx1024M represents the heap size. By default, this is set to 1GB (1024M). To increase the heap size, change 1024 to a larger number.
Define update rates or tiling size settings for individual dashboards Copied
By default, the settings in the <dashboardDefaults> element are applied
to all dashboards configured in Web Dashboard. However, if these
settings are not adequate for an individual dashboard, specific
settings may be set for that dashboard only.
Edit the dashboard entry in config.xml and add the new settings.
Example:
<dashboardDefaults>
   <updateRate>5</updateRate>
   <dashboardRefreshRate>3</dashboardRefreshRate>
   <tileSize>
          <width>200</width>
          <height>200</height>
   </tileSize>
</dashboardDefaults>
<dashboards>
        <dashboard name="Dashboard1" path="/root/dashboards/uploaded/db1.adb"/>
        <dashboard name="Dashboard2" path="/root/dashboards/uploaded/db2.adb"/>
        <dashboard name="Dashboard3" path="/root/dashboards/uploaded/db3.adb">
                <!-- DASHBOARD SPECIFIC SETTINGS -->
                <updateRate>10</updateRate>
                <dashboardRefreshRate>5</dashboardRefreshRate>
                <tileSize>
                        <width>400</width>
                        <height>400</height>
                </tileSize>
        </dashboard>
</dashboards>
In this example, “Dashboard1” and “Dashboard2” use the default settings, while “Dashboard3” has its own settings.
Redirect the dashboard loading folder Copied
By default, Web Dashboard uploads the .adb files into the
<web\_dashboard\_install\_dir>/dashboards/uploaded/ folder and then
loads the dashboard from that location.
If a different location is required, edit config.xml to change the
path attribute of the dashboard under the <dashboards> element.
Example:
<dashboards>
  <dashboard name="Dashboard_A2" path="/home/gelo/etc/support_dashboard.adb"/>
  <dashboard name="Dashboard_B1" path="/home/gelo/etc/test.adb"/>
  </dashboard>
</dashboards>
Resolve the high CPU/memory of Web Dashboard Copied
CPU and memory used by Web Dashboard are largely determined by the contents and updates of the dashboards it has been configured with.
Edit config.xml to slow down the update rate for:
- The
<dashboardDefaults>element - this action implies that the new settings for<updateRate>and<dashboardRefreshRate>are applied to all dashboards. - Individual dashboards if they have been identified as main
contributors to the high CPU/memory - the settings for
<updateRate>and<dashboardRefreshRate>need to be added to the specific dashboard under the<Dashboards>element.
In both cases, it is recommended that <dashboardRefreshRate> is
equal or faster than <updateRate> to ensure timely updates.
Resolve the constant flickering and blank areas of a dashboard on display Copied
This issue may be the result of:
- Having more updates than those processed by Web Dashboard in the time set by the
<dashboardRefreshRate>parameter. If this is the case, increase the value of this parameter up to the value of the<updateRate>parameter. - Having increased the tile size, which implies that there is too much data through the network for each tile.
If this is the case, reduce the values of the
<tileSize>element.
Prevent memory buildup due to gateway disconnection Copied
By default, Web Dashboard will try to reconnect to a disconnected gateway over and over again until the connection is restored. This, in turn, causes rapid memory buildup. To prevent this behavior:
- Edit the
runscript to add:
export ORBFASTER_FAST_CALLBACK=false
- Save the changes and restart Web Dashboard.
Apply MySQL to Web Dashboard Copied
Web Dashboard supports database queries required for historical
charts. Although no changes are required for Sybase, MSSQL, or Oracle,
the connection to MySQL needs to be manually incorporated to the geneos-web-server.jar file.
- Create a temporary directory (e.g., gws) under the Web Dashboard installation directory.
- Copy
geneos-web-server.jarinto the gws directory. - Extract the jar file with the following command:
jar xvf geneos-web-server.jar
The gws directory will contain the folders: com and META-INF.
- Delete
geneos-web-server.jarfrom the gws directory. - Navigate to the
META-INFfolder. - Open
MANIFEST.MFin an editor. - Add the path to the MySQL driver to the end of the Class-Path pair and save the
MANIFEST.MFfile. - Go back to the gws directory and recreate
geneos-web-server.jarwith the following command:
jar cmf META-INF/MANIFEST.MF geneos-web-server.jar *
- Replace
geneos-web-server.jarin the Web Dashboard installation directory with the newgeneos-web-server.jarfile just created.
Note
The jar command is present in the Java JDK package, and the path must be indicated.
The MANIFEST.MF file must end with a blank line, and the maximum width of the line is 70 characters.
Enable DEBUG in Web Dashboard Copied
Sometimes, there may be issues with Web Dashboard that need further investigation, and a detailed log file may be useful.
- Edit
log4j.propertiesand modify thelog4j.rootLoggerparameter from:
log4j.rootLogger=off, CONSOLE, FILE
to:
log4j.rootLogger=DEBUG, CONSOLE, FILE
- Save the changes and restart Web Dashboard.
- Repeat the actions that led to the issue.
- Send the log file to Geneos Support for assistance.
Enable JMX port for remote monitoring Copied
JMX can be used to remotely monitor the GatewayMonitor and DashboardMonitor MBeans.
To do this, enable the JMX_PORT and JMX_FLAG debugging flags in the run script of your installation.
JMX_PORT=50505
JMX_FLAGS="-Dcom.sun.management.jmxremote.port=$JMX_PORT -Dcom.sun.management.jmxremote.authenticate=false
-Dcom.sun.management.jmxremote.ssl=false"
GatewayMonitor MBeans Copied
The GatewayMonitor MBean attributes are as follows:
| Field | Description |
|---|---|
| GatewaysCount | Number of Gateways configured. |
| GatewayInformation | List of CompositeData that represents each GatewayDetails of configured gateways. |
| GatewaysAreDown | Indicates when one of the gateways connected to the Web Dashboard is down. |
Each item in the CompositeData list contains GatewayDetailsthat represents Gateway attributes:
| Field | Description |
|---|---|
| name | Gateway name. |
| versionString | Gateway version. |
| statusInfo | Gateway status information. |
| isConnected | Gateway connection current status. |
| isConnectedToSecondary | Shows if the Gateway is connected to the secondary Gateway. |
| hostNameAndPort | Gateway host name and port. |
| primaryHostAndPort | Primary Gateway host and port. |
| secondaryHostAndPort | Secondary Gateway host and port. |
| connectionState | Connection state of the Gateway. Values: -2 : Unknown state -1 : In error 0 : Waiting for the connection to be established 1 : Waiting for the system to start 2 : Connected 3 : Disconnected 4 : Connected, waiting for the data state 5 : Authenticating |
DashboardMonitor MBean Copied
The DashboardMonitor MBean attributes are as follows:
| Field | Description |
|---|---|
| DashboardsCount | Number of dashboards that are currently configured in the navigation page. |
| DashboardInformation | List of CompositeData that represents each DashboardDetails of configured dashboards in the navigation page. |
Each item in the CompositeData list contains DashboardDetailsthat represents Gateway attributes:
| Field | Description |
|---|---|
| displayName | WebDashboard display name. |
| clientRequestRate | Web server refresh rate of the dashboard based on the <updateRate> property. |
| dashboardRefreshRate | Dashboard refresh rate configured in the <dashboardRefreshRate> property. |
| lastUpdateTime | Date and time since the dashboard received updates from the Gateway. |
Gateway connections are not displayed when opening the configuration interface Copied
Frequent manipulation of config.xml may disrupt the presentation of the Connections page.
Press the “Reload” button to restore the gateway connections or press F5 to refresh the page.
Cannot remove a dashboard in the Dashboards configuration interface Copied
This action will not be allowed if the dashboard has been configured in the Navigation tree and has been included in Slideshows.
- Remove the dashboard from Slideshows and then in the Navigation tree.
- Remove the dashboard from the Dashboards configuration interface.
Slideshow on display does not seem to update if a new dashboard has been added Copied
Press F5 to refresh the slideshow on display.