Gateway Plug-Ins
Overview Copied
Gateway plugins run on the Gateway, instead of an external Netprobe processes. They typically provide a mechanism for exposing Gateway specific parameters to the monitoring capabilities of Geneos. The different Gateway plugins that are available are described in this topic.
Gateway RunTime Parameters Copied
The Severity Count, Severity Data, Snooze Data and User Assignment Data plugins have the following Gateway runtime parameters available at the Sampler level:
GatewayName— Name of the Gateway.GatewayHost— Hostname of Standalone or Primary Gateway (in case of Hot Standby pair).GatewayPort— Port of Standalone or Primary Gateway (in case of Hot Standby pair).SecurePort— If Gateway is listening or secure port (true/false).SecondaryHost— The hostname of Secondary Gateway (in case of Hot Standby pair).SecondaryPort— The port of Secondary Gateway (in case of Hot Standby pair).
Breach predictor Copied
Introduction Copied
A breach is defined as reaching or crossing a maximum tolerable threshold value for any entity or configurable variable in the Gateway.
Intra-day breach prediction is a feature that allows you to do breach prediction calculations for any particular variable or set of variables. This prediction is done based on the model data supplied by you as a Time series and logged to the database. Intra-day breach prediction performs the prediction based on only one day’s worth of data.
You can use the predicted information in a rule to be alerted well in advance if a breach will occur, so that you can take appropriate steps.
Configuration View Copied
On creation, the Breach Predictor Plugin has an empty predictor.
A predictor is a logical grouping of dataview cells on which breach prediction is to be performed. You must configure at least one predictor. There is no upper limit.
Clicking on Add new link presents the configuration options for a predictor. This presents options for the following:
The remainder of the settings are identical to any other Gateway plugin.
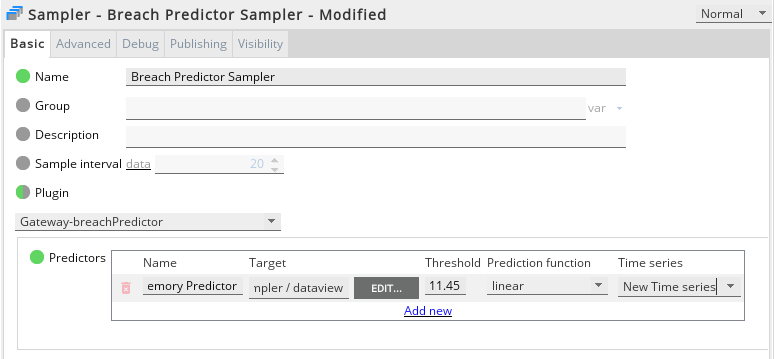
Predictor Settings Copied
The settings below define the predictor.
predictors > predictor Copied
A predictor is a logical grouping of the dataview cells that you want to use for the breach prediction calculation. You must create at least one predictor. There is no upper limit.
Mandatory: Yes (at least one predictor must be configured per plugin)
predictors > predictor > name Copied
Name you want to identify each predictor with. Each predictor name should be unique across an instance of the plugin.
The name must not be empty because this throws a validation error in the Gateway Setup Editor.
Mandatory: Yes
predictors > predictor > target Copied
Xpath name or the data items that this predictor applies to. See Xpaths User Guide for more information on XPaths.
Mandatory: Yes
predictors > predictor > threshold Copied
Specifies a threshold value that is to be used for the breach prediction calculation.
The threshold value must be a valid double value otherwise the predictor is ignored. The threshold is used as an upper limit value for breach prediction calculation. There is no way to provide a lower limit threshold value for breach prediction calculation within a particular range. The threshold can be a positive or negative value.
Mandatory: No
Default: 0.0
predictors > predictor > predictionFunction Copied
The prediction function specifies which prediction function is to be used for prediction calculation. The drop down provides 2 values.
Mandatory: No
Default: Linear
| Value | Effect |
|---|---|
| linear | Linear function is used for breach prediction calculation. |
| percentage | Percentage based function is used for breach prediction calculation. |
predictors > predictor > predictionFunction > linear Copied
Linear based prediction is where the predicted values of the cell follow a graph which simulates the gradient of the cell values provided by the time series.
For example, the table below shows the values provided by the time series in second row. The current time is 9:00 and the current value of a cell is 5.00.
The predicted values of the cell follow the gradient of the values provided by the time series. Therefore, if the threshold value specified as 25.00, the breach is predicted to occur at 11:00.
| Time | 9:00 (current time) | 10:00 | 11:00 | 12:00 | 13:00 | 14:00 | 15:00 | 16:00 | 17:00 |
| Values from Time Series | -10.00 | 0.00 | 10.00 | 20.00 | 30.00 | 40.00 | 30.00 | 20.00 | 10.00 |
| Predicted Values | 5.00 (current value) | 15.00 | 25.00 | 35.00 | 45.00 | 55.00 | 45.00 | 35.00 | 25.00 |
predictors > predictor > predictionFunction > percentage Copied
Percentage based prediction is where prediction is based on the percentage difference between the values provided by the time series and current value of the cell. The prediction cannot be done if the current value of cell is zero.
Example 1: The table below shows the values provided by the time series in second row. The current time is 9:00 and the current value of a cell is 20.00.
If the threshold value specified as 100.00, the breach is predicted to occur at 13:00.
| Time | 9:00 (current time) | 10:00 | 11:00 | 12:00 | 13:00 | 14:00 | 15:00 | 16:00 | 17:00 |
| Values from Time Series | 10.00 | 20.00 | 30.00 | 40.00 | 50.00 | 60.00 | 70.00 | 80.00 | 90.00 |
| Predicted Values | 20.00 (current value) | 40.00 | 60.00 | 80.00 | 100.00 | 120.00 | 140.00 | 160.00 | 180.00 |
Example 2: The table below shows the values provided by the time series in second row. The current time is 9:00 and the current value of a cell is -15.00.
If the threshold value specified as 20.00 the breach is predicted to occur at 16:00.
| Time | 9:00 (current time) | 10:00 | 11:00 | 12:00 | 13:00 | 14:00 | 15:00 | 16:00 | 17:00 |
| Values from Time Series | -30.00 | -20.00 | -10.00 | 0.00 | 10.00 | 20.00 | 30.00 | 40.00 | 70.00 |
| Predicted Values | -15.00 (current value) | -10.00 | -5.00 | 0.00 | 5.00 | 10.00 | 15.00 | 20.00 | 35.00 |
predictors > predictor > timeSeries Copied
Specifies a time series that is created in the data sets. The drop down shows a list of all the time series that have been created in the data sets.
If the user does not select any time series, then the corresponding rows in the breach predictor dataview state that the time series is non-existent and no prediction is done. The prediction is done only if the time series is valid and has data points updated from the database.
Mandatory: Yes
Dataview Copied
Upon configuring a valid breach predictor Gateway plugin, a data view appears for the plugin. The data view displays as many rows as the total number of data view cells that have been configured through XPaths in all the predictors for that Breach Predictor Gateway plugin.
Note
Beginning Geneos 5.5.x, the Managed Entity display name is used in the user readable paths throughout the Gateway Setup Editor, except when the GSE is opened as a standalone application. This only applies if you open the GSE within the Active Console.
Table legend Copied
| Column Name | Description |
|---|---|
| Id | Unique identifier for this cell. Prepends Predictor name for identifying which predictor it belongs to. |
| componentType | The directory component type of this dataitem. One of:
|
| probe | The probe for this dataitem. |
| managedEntity | The managed entity for this dataitem. |
| sampler | The sampler for this dataitem. |
| dataview | The dataview for this dataitem. |
| cell | The cell for this dataitem. |
| type | The configured type for this dataitem. |
| currentValue | The value for this dataitem (in double). |
| thresholdValue | Threshold value provided in the predictor. |
| timeSeries | Name of the time series used as a model value for breach prediction calculation. |
| timeToBreach | The delta in seconds between the current time and the forecasted time to breach. If the breach was forecasted but has not occurred, and the current time has passed the forecasted breach time, then the value is a negative number (the current time value is greater than the forecasted time to breach value). A negative value does not mean it has breached. If a breach has occurred, the value is blank. |
| timeOfBreach | The predicted time of Breach. Blank in case the cell value is not expected to breach or if the prediction cannot be done. |
| description | Information about the breach. One of:
|
Client connection data Copied
samplers > sampler > plugin > Gateway-clientConnectionData Copied
The plugin monitors currently connected client applications. This includes:
- Active Console
- Open Access Server
- Webslinger
- Gateways that import data from this Gateway
Headline legend Copied
The headline cells above the table display the following data:
| Name | Description |
|---|---|
| clientConnectionCount | Number of clients connected. |
Table legend Copied
The table cells display the following data:
| Column Name | Description |
|---|---|
| connectionId | Connection identifier for this client. |
| component | Component name of this client. |
| release | The release version of this client. |
| releaseAge | The time in days since the client version was created. |
| hostname | The hostname that the client is connecting from. |
| ipaddress | The ipaddress that the client is connecting from. |
| security | Whether the client has connected to this Gateway using a secure or insecure connection. |
| duration | The number of minutes since the client connected. |
| expiresIn | The time in minutes until the client SSO credentials will expire. This will be blank if this is not an SSO connection. In normal running the client will refresh the credentials before they expire. |
| userName | The user associated with this connection. |
| userFullName | The full name of the user associated with this connection. |
| userDomain | The domain of the user associated with this connection. |
| ssoUser | Whether this is an SSO user (true, false). |
| genericUser | Whether this is a generic user (true, false). |
| userGroups | List of groups that this user belongs to. |
| connectionType | The connectionType indicates how the system is transferring data to the client. This is one of:
|
| numFullySyncedDataviews | The number of dataviews for which every cell is sent to the client every time it changes value. |
Database logging Copied
samplers > sampler > plugin > Gateway-databaseLogging Copied
The plugin monitors the database logging configuration and status of everything that is logged from Gateway to a database.
The plugin has three views: Summary View, Cache view, and Items view.
Summary view Copied
Summary view shows the overall database settings and connection status. For example:
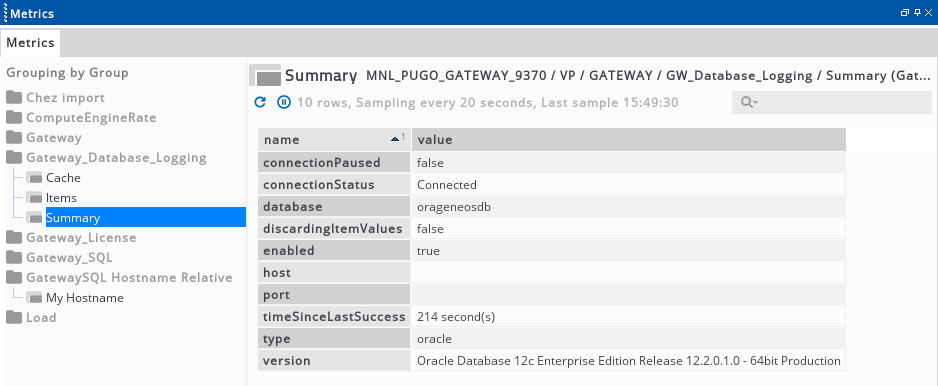
Legend Copied
| Property | Description |
|---|---|
| host | The configured host for the Gateway’s database connection. (This will be blank for Oracle and Sybase connections). |
| port | The configured port for the Gateway’s database connection. (This will be blank for Oracle and Sybase connections). |
| database | Database name |
| type | Type of database (MySQL, SQLServer, Sybase, Oracle) |
| version | Version of the database (if connected). |
| enabled | Is database logging enabled (true, false) |
| connectionStatus | Status of database connection if enabled (Pending, Connected, Not Connected) |
| connectionPaused | Is database connection paused (using Database Logging → Connection → pause command) |
| discardingItemValues | Is discarding item values (using Database Logging → Item values → discard command) |
| timeSinceLastSuccess | Time in seconds since last successful log to the database. This is updated every sample interval. |
| databaseSchemaVersion | Version number of the database schema. This is read from the database at connection time. |
| gatewaySchemaVersion | Maximum version of the database schema that the Gateway supports. |
Points to Note:
- When the Gateway connects to a database, the ‘connectionStatus’ will be ‘Connected’. If the user then pauses the database connection (using Database Logging -> Connection -> pause command), the connection will be dropped from the Gateway and the ‘connectionStatus’ will update to ‘Not Connected’. If the user then resumes the connection, the ‘connectionStatus’ will not update until there is something to log to the database at which point the Gateway will re-establish connection to the database and the ‘connectionStatus’ would reflect this as ‘Connected’.
- The
severityvalue reported in this dataview reflects the severity of the Gateway, thus it is affected by severity and snooze data imported from other Gateways as well as severity and snooze data generated on this Gateway. - If the Gateway is started in paused connection mode, then the ‘connectionStatus’ would sit at ‘Pending’ state until the user resumes the database connection.
Cache view Copied
Cache view gives details about the internal queue and cache (dump) files statistics. For example:
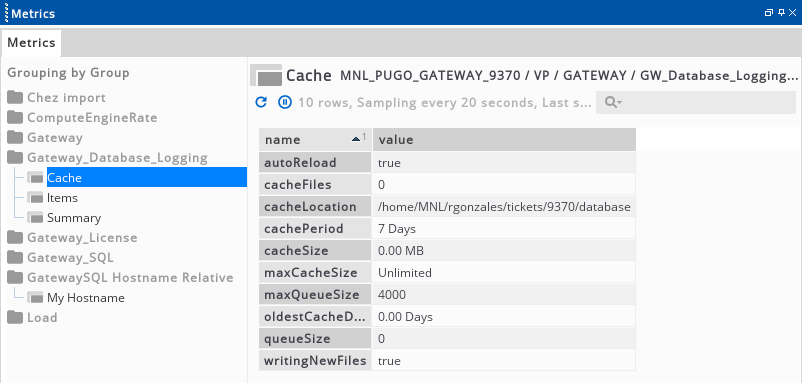
Legend Copied
| Property | Description |
|---|---|
| autoReload | Is auto reloading of dump files enabled (true/ false) |
| cacheFiles | No of dump files on disk |
| cacheLocation | The directory where dump files are created/stored |
| cachePeriod | The maximum duration for which dump files will be stored before the oldest file is discarded |
| cacheSize | Total size of the dump files on disk |
| maxCacheSize | The upper limit for the total size of the dump files as configured in the setup |
| queueSize | Current internal queue size (Internal queue holds the log requests which are yet to make into database) |
| maxQueueSize | The upper limit for the internal queue size as configured in the setup. When this limit is hit, the log requests are dumped to disk (if dump files creation is enabled) |
| oldestCacheData | The oldest dump file on disk (in days) |
| writingNewFiles | Is creation of new dump files enabled (true/false) |
Items view Copied
Items view gives details about the DB items configured in the setup such as which table are they configured to log to, the number of live data cells matching their target paths, and how many of those have been logged or failed to log.
Below is a snapshot of how the Items view might look:

Headline legend Copied
The headline cells above the table display the following data:
| Name | Description |
|---|---|
| successfullyLogging | Total number of data items from all DB items target XPaths that were successfully logged to the database on their last value update. |
| failingLogging | Total number of data items from all DB items target XPaths that failed to log to the database on their last value update. |
| loggingNotAttempted | Total number of data items from all DB items target XPaths that were not attempted to log to the database on their last value update. |
Table legend Copied
The table cells display the following data:
| Column Name | Description |
|---|---|
| name | Name of the DB item configured in the setup |
| table | The database table it is configured to log to |
| active | Whether active when active time is configured. (active/inactive). If active time not configured, it is always active. |
| matchingDataItems | The number of live data cells that match all the target XPaths configured per this DB item. |
| successfullyLogging | The number of data items that were successfully logged on their last value update. |
| failingLogging | The number of data items that failed to log on their last value update. |
| loggingNotAttempted | The number of data items that were not attempted to log on their last value update. |
Points to Note:
- The ‘matchingDataItems’ reflects count of all data items that match the target XPaths in the DB item. A dataitem may match more than one target XPaths in the DB item, hence, this value is not a count of unique data items. Same is true for ‘successfullyLogging’, ‘failingLogging’, ’loggingNotAttempted’ counts.
- A dataitem may match multiple target XPaths across different DB items. Hence, the headlines ‘successfullyLogging’, ‘failingLogging’ and ’loggingNotAttempted’ is not a count of unique data items in the system.
- The ‘successfullyLogging’, ‘failingLogging’, ’loggingNotAttempted’ count are not updated when a configured active time enters inactive period.
- The ‘failingLogging’ count will go up when the database connection is paused and there are data item value updates.
Exported data Copied
samplers > sampler > plugin > Gateway-exportedData Copied
Table legend Copied
The table cells display the following data:
| Column Name | Description |
|---|---|
| connectionId | Connection identifier for importing Gateway. |
| gatewayName | Name of importing Gateway. |
| requestedDataSets | List of data sets that the importing Gateway has requested. |
| providedDataSets | List of data sets that have actually been provided to the importing Gateway. |
| connectedUser | User name if available that was used to authenticate the connection. |
The connectionId column is the same as the connectionId column in the client connection plugin. This allows rules to be used that take data from both these plugins and merged dataviews to be created using the Gateway-sql plugin.
Note
Under normal circumstances, the requestedDataSets and the providedDataSets should be the same. These will only differ if the importing Gateway is requesting a data set that does not exist on the exporting Gateway.
Forecaster Copied
Prerequisites Copied
- Install the Forecaster app. Refer to the installation guide for ITRS Analytics apps.
- Configure a Forecaster. Refer to the Forecaster app user guide.
- Ensure that you can to publish data to ITRS Analytics. Your Connection > Publishing settings must be configured correctly.
- Ensure that you can to retrieve data from ITRS Analytics. Your Connection > Data Access settings must be configured correctly.
samplers > sampler > plugin > Gateway-forecaster Copied
The plugin allows the consumption of ITRS Analytics forecasted time-to-breach data and presents it visually on the Active Dashboard. This data enables you to establish rules, such as forecasting when a breach of a particular metric will occur. To use this plugin, you need to send data from the Gateway to ITRS Analytics. This can be done by setting up the ITRS Analytics Connection. For more information, see Connect Geneos to ITRS Analytics.
The plugin employs REST APIs to retrieve data from ITRS Analytics Forecaster. As this involves establishing a connection to ITRS Analytics, you must initially set up an ITRS Analytics endpoint. This can be configured with two parameters:
- Group
- Names (optional list of names)
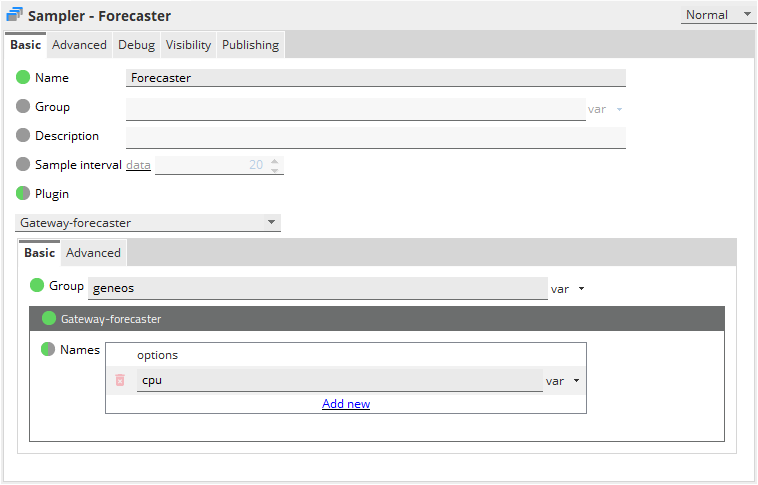
Note
Results only display forecasts for metrics from the current Gateway.
If Group is the only parameter configured, then all available names will be displayed in the Active Dashboard. Otherwise, if one or more Names are specified, then the dataview will be populated only with the information that ITRS Analytics Forecaster provides for those names.
Note
If multiple groups are required, then you have to create multiple plugins.
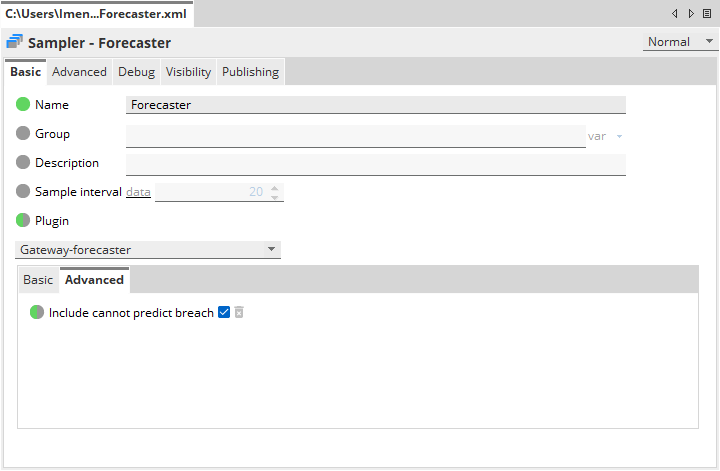
You can also choose whether to include items in the dataview for which the forecaster is unable to predict breaches. By default, items that the forecaster cannot predict will also be included. Refer to the screenshot below for the setting:
Once the data becomes available, the dataview will appear as follows:

Headline legend Copied
The headline cells above the table display the following data:
| Name | Description |
|---|---|
| countCannotPredict | Count of items that the Forecaster cannot predict, such as due to insufficient available data points. These items will be either included or excluded from the dataview based on whether the Include cannot predict breach setting has been enabled or disabled. |
| countDataviewsNotFound | Number of dataviews identified by the dimensions but that are not available in the Gateway. |
| userRequestedConfig | Represents the group that the user requested. |
| userRequestedAvailableNames | Contains a list of the names that the user requested and that are also available from ITRS Analytics Forecaster. |
| userRequestedUnavailableNames | Prints the list of names that the user requested but are not available from ITRS Analytics Forecaster. |
| samplingStatus | Displays OK or an error message if there is an issue with fetching and collecting data from ITRS Analytics. |
Table legend Copied
The table cells display the following data:
| Name | Description |
|---|---|
| id | A unique hash to identify the item in the table. |
| name | Name of the Forecaster in the group. |
| metric | Identifies the metric used by the Forecaster. Dimensions:
|
| value | Value corresponding to the dataview cell identified by the dimensions above. |
| breachStatus | It can be either BREACH, NO_BREACH, or CANNOT_PREDICT. If the Forecaster does not have enough data to forecast a time-to-breach then it will display CANNOT_PREDICT. |
| warningBreachTime/criticalBreachTime | Breach time expressed as a point in time if reported by Forecaster. |
| warningThresholdValue/criticalThresholdValue | It is consistently available when there is a breach of the warning threshold. |
| warningDurationToBreach/criticalDurationToBreach | Breach time calculated as time of request if reported by Forecaster. |
Gateway data Copied
samplers > sampler > plugin > Gateway-gatewayData Copied
The plugin monitors the current configuration and state of this Gateway.
Legend Copied
The plugin provides the following properties:
| Property | Description |
|---|---|
| gatewayName | Configured unique name for the Gateway. |
| gatewayId | Unique identifier for the Gateway. |
| release | Release version of the Gateway. |
| releaseAge | The time in days since the Gateway version was created. |
| hostname | Hostname of the machine the Gateway is running on. |
| ipAddress | IP address of the machine the Gateway is running on. |
| secureGatewayPort | EMF2 port for the Gateway that is used to listen for TLS connections. |
| insecureGatewayPort | EMF2 port for the Gateway that is used to listen for insecure TCP connections. |
| sslCertificateDaysRemaining | Indicates the number of days remaining before the SSL Certificate of a Gateway expires.
|
| hotStandbyRole | Current hot standby role of the Gateway (Unknown, Stand Alone, Primary, Secondary). |
| hotStandbyEnabled | Is hot standby configuration enabled (true, false) |
| hotStandbyFailbackStrategy | How does the Primary Gateway in a Hot-standby pair behave on restart with an Active Secondary?
|
| secondaryGatewayHostname | Hostname of the secondary Gateway if hot standby is enabled and connected to a primary Gateway. |
| secondaryGatewayPort | Port of the secondary Gateway if hot standby is enabled and connected to a primary Gateway. |
| secondaryGatewayConnectionStatus | Connection status to the secondary Gateway if hot standby is enabled and connected to a primary Gateway. |
| primaryGatewayHostname | Hostname of the primary Gateway if hot standby is enabled and connected to a secondary Gateway. |
| primaryGatewayPort | Port of the primary Gateway if hot standby is enabled and connected to a secondary Gateway. |
| gatewaySetupFile | Name of the primary setup file for this Gateway. |
| setupIncludeFiles | Names of all included setup files for this Gateway |
| insecurePasswordLevel | The level at which insecure passwords are being reported in the setup (None, Warning, Error, Critical). |
| gatewayLogFile | Name of the log file for this Gateway. |
| licenseFile | Name of the temporary license file. |
| licenseExpiryDate | Expiry date of the license file for this Gateway |
| licenseDaysRemaining | Number of days before the license expires. |
| severity | The runtime severity of this Gateway. |
| databaseLoggingEnabled | Is database logging enabled (true, false) |
| schemaVersion | Version of the schema currently applied to this Gateway. |
| aesKeyType | Describes the keys used by the Gateway to encrypt and decrypt passwords. The possible values are the following:
|
Note
Refer to Database Logging for more information about database connectivity.
Gateway Hub data Copied
Introduction Copied
The Gateway Hub Data plugin monitors the current configuration and state of publishing to Gateway Hub from this Gateway. The plugin has two dataviews:
- Summary
- Nodes
Summary dataview Copied
The summary dataview provides general information regarding publishing from the Gateway to Gateway Hub.
Table legend Copied
The table cells display the following data:
| Column Name | Description |
|---|---|
| Enabled | Indicates if Gateway Hub publishing is enabled. |
| Status | Indicates the status of the
Gateway Hub connection. This has the following possible values:
|
| Message rate | The rate at which messages are sent to Gateway Hub, measured in the number of messages per second. This is the rate at which messages are sent, not the rate they arrive. |
| Messages dropped per sample |
Number of messages dropped in the last sample. If this value is above zero, you should investigate your Gateway and broker logs to identify the cause. You may need to resize your Gateway Hub configuration. See Queue Size below. |
| Queue Size |
Size of the message queue. Messages are buffered in a queue at the Gateway if Gateway Hub is slow in consuming sent messages. If the queue is full, then any new messages sent are dropped. The default maximum queue size is 100,000 messages. |
| Num of dataviews published | Number of dataviews that are published to Gateway Hub. |
| Num of dataviews unpublished | Number of dataviews that are not published to Gateway Hub because publishing has been disabled in the Gateway configuration. |
| Num of dataviews with errors | Number of dataviews that are not published due to lack of sampler schema or incomplete sampler schema. |
Nodes dataview Copied
The nodes dataview provides information about the publishing and REST nodes.
Headline legend Copied
The headline cells above the table display the following data:
| Name | Description |
|---|---|
| publishingNodes | Number of publishing nodes configured. |
| restNodes | Number of REST nodes configured. |
| gatewayHubVersion | Version of Gateway Hub the Gateway is publishing to. |
Table legend Copied
The table cells display the following data:
| Column Name | Description |
|---|---|
| location | URL or IP address for the node. |
| Type | Indicates whether this is a
REST or PUBLISHING node.
|
Show Dataviews Command Copied
The Show Dataviews command is available by right-clicking on the cells in the following columns and navigating to Gateway Hub > Show Dataviews:
- Num of dataviews published
- Num of dataviews unpublished
- Num of dataviews with errors
The command opens a new window showing a table identifying the dataviews contributing to the count in that cell.
The table has the following columns:
- Managed Entity
- Sampler
- Type
- Dataview
Gateway load Copied
Usage Warning
The Gateway Load Monitoring plugin is intended for diagnostic use only. It should only be enabled when experiencing Gateway performance issues and you need to identify potential causes of slowdown. Use it temporarily for performance tuning and disable it once diagnostics are complete to avoid unnecessary overhead.
It is not recommended to run this plugin continuously as it introduces additional load on the Gateway.
samplers > sampler > plugin > Gateway-gatewayLoad Copied
The Gateway Load Monitoring feature provides various statistics about the runtime state of a Gateway. These statistics include processing times spent in various features, and can be viewed using configured instances of the load monitoring plugin.
The load monitoring plugin has several different display modes, which allow users to obtain either a broad high-level overview of the current Gateway state, or to drill down to examine statistics for a particular item.
The expected use for this plugin is primarily for troubleshooting, or to pinpoint specific components that are causing or contributing to a problem. For a more detailed description on this, see Gateway Performance Tuning.
Categories Copied
Load monitoring statistics are broken down into several categories of statistic. Each of these categories is displayed by the load monitoring plugin as a separate view mode, controlled by the category setting.
Component Statistics Copied
The Component stats category is the default display mode for the load monitoring plugin. These statistics summarise how much time is being spent processing each Gateway feature.
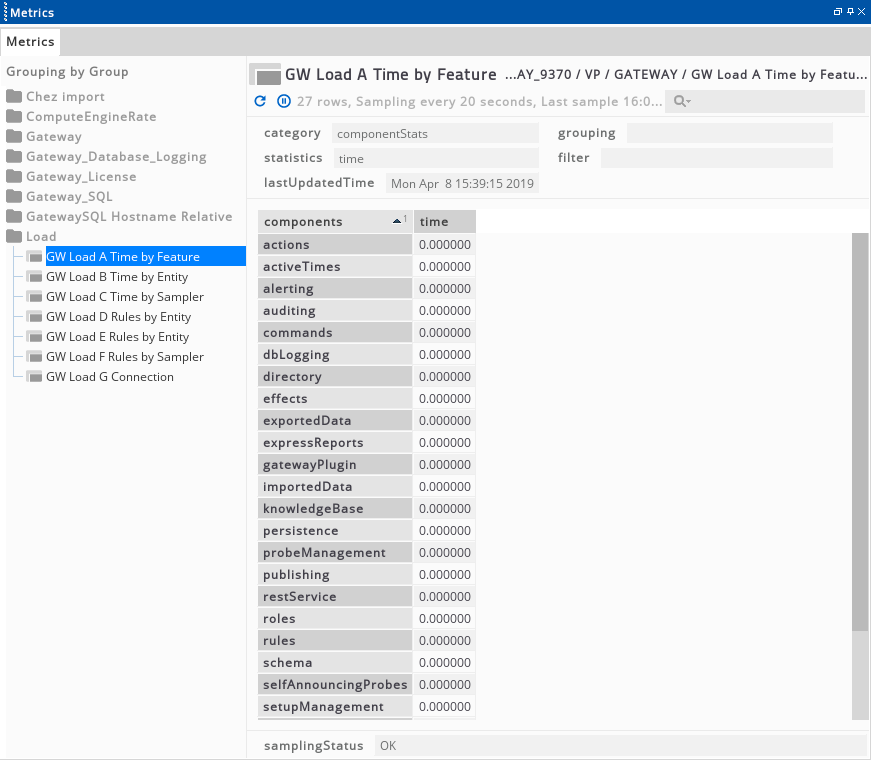
Headline legend Copied
The headline cells above the table display the following data:
| Name | Description |
|---|---|
| category | The load monitoring statistics category being displayed. |
| grouping | The currently configured grouping mode, if any. |
| statistics | The statistics being displayed. This will be “time” for the componentStats category. |
| filter | The currently configured filter, if any. |
| lastUpdatedTime | Time the underlying data being displayed was last updated. |
Table legend Copied
The table cells display the following data:
| Column Name | Description |
|---|---|
| components | Row identifier |
| time | Total amount of CPU time spent on each component. Time units vary per platform, and should be used for relative comparisons only. |
The features reported on are as follows:
- Actions
- Active Times
- Alerting
- Auditing
- Commands
- Database Logging
- Directory
- Includes constructing and modifying the state tree among other tasks.
- Effects
- Knowledge Base
- Licencing
- Probe Management
- Includes establishing and maintaining communication with Netprobes.
- Roles
- Includes the time spent on Hot-Standby functionality.
- Rules
- Schema
- Self-Announcing Netprobes
- Setup Management
- Snooze
- Ticker Events
- Time Series
- User Assignment
- User Management
- Other user functionality not related to assignment.
Note
A high amount of time spent in some components relative to others is expected in a normal Gateway configuration, as not all Gateway features are used to the same degree.
Gateway plugin statistics Copied
The Gateway plugin stats category shows a breakdown of the time spent in each configured Gateway plugin.
Headline legend Copied
The headline cells above the table display the following data:
| Name | Description |
|---|---|
| category | The load monitoring statistics category being displayed. |
| grouping | The currently configured grouping mode, if any. |
| statistics | The statistics being displayed. This will be “time” for the componentStats category. |
| filter | The currently configured filter, if any. |
| lastUpdatedTime | Time the underlying data being displayed was last updated. |
Table legend Copied
The table cells display the following data:
| Column Name | Description |
|---|---|
| group | Row identifier |
| time | Total amount of CPU time spent on each component. Time units vary per platform and should be used for relative comparisons only. |
Directory Statistics Copied
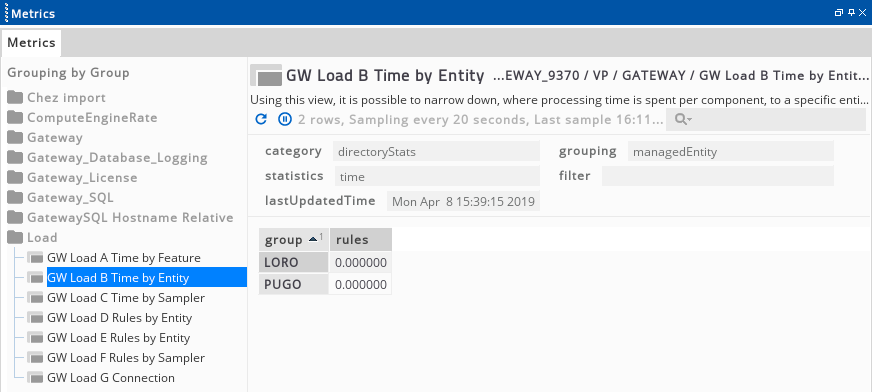
Several Gateway features operate on Data-items selected by a user-configured XPath. The Directory stats category provides information about the items a feature is operating on, with corresponding location information from the directory, such as the Netprobe or Managed Entity that an item is associated with. It is therefore possible to identify a particular probe or plugin whose data is causing excessive load on the Gateway.
Headline legend Copied
The headline cells above the table display the following data:
| Name | Description |
|---|---|
| category | The load monitoring statistics category being displayed. |
| grouping | The currently configured grouping mode, if any. |
| statistics | The statistics being displayed. One of "time", "rules" or "dbLogging" depending on selected option. |
| filter | The currently configured filter, if any. |
| lastUpdatedTime | Time the underlying data being displayed was last updated. |
Table legend Copied
The table cells display the following data:
| Column Name | Description |
|---|---|
| group | Name of the group, the precise type being specified by the grouping mode. |
| dbLogging | Total amount of CPU time spent for that grouped item (and all contained items in the group) on database logging. |
| rules | Total amount of CPU time spent for that grouped item (and all contained items in the group) on rules. |
| matchingItems | Displayed for some statistics modes. This column shows the count of matchingItems (i.e. number of contained items in the group) for the selected feature, for that group. |
| time | Displayed for some statistics modes. Shows the CPU time spent for the selected feature, for that group. |
| updates | Displayed for dbLogging statistics. The number of times a database logging target value changed, causing a check to see if the new value should be logged. |
| evaluations | Displayed for rule statistics. The number of times a property change on a matched data-item caused a rule evaluation. |
At present two features are instrumented at this level: Rules and Database Logging. Statistics for these can be shown as a total time side-by-side, or in a view containing specific details for either of the features.
The directory statistics mode also allows users to group and filter items to help drill down to problem areas. Grouping allows statistics to be displayed (for example) at a Sampler or Managed Entity level. Values are aggregated at the grouping level, so an entity grouping would sum all values within a given entity.
Filtering items allows the views to be restricted to a particular entity or rule for example, and removes other counts from the aggregate statistics of the grouping.
Connection Statistics Copied
The Connection stats category displays low-level details about the network traffic to and from the gateway. Connection data will include Netprobes, connected clients such as Active Console or Web Dashboards, as well as other components such as a hot-standby Gateway, Licence Daemon or web-based http connections.
Headline legend Copied
The headline cells above the table display the following data:
| Name | Description |
|---|---|
| category | The load monitoring statistics category being displayed. |
| grouping | The currently configured grouping mode, if any. |
| statistics | The statistics being displayed. |
| filter | The currently configured filter, if any. |
| lastUpdatedTime | Time the underlying data being displayed was last updated. |
Table legend Copied
The table cells display the following data:
| Column Name | Description |
|---|---|
| connection | The host and port of the remote side of the connection. |
| WriteStreamLength | Data in KB to be sent from the gateway. |
| ReadStreamLength | Data in KB that have not yet been processed. |
| MessagesQueued | For a Netprobe or Active Console connection, the number of messages waiting to be processed. |
| SendRate | Rate of data sent in the last 10 seconds (KB/s) |
| ReceiveRate | Rate of data received in the last 10 seconds (KB/s) |
| MemoryInUse | Total amount of memory used for send and receive buffers. |
Xpath Statistics Copied
The Xpath stats category displays information about XPath evaluations within the gateway. These paths are used both for user-configured items such as rule targets, as well as internally for tasks such as executing commands. Due to the complexity of paths, it is recommended to use this category for debugging under the instruction of ITRS support staff.
Headline legend Copied
The headline cells above the table display the following data:
| Name | Description |
|---|---|
| category | The load monitoring statistics category being displayed. |
| grouping | The currently configured grouping mode, if any. |
| statistics | The statistics being displayed. |
| filter | The currently configured filter, if any. |
| lastUpdatedTime | Time the underlying data being displayed was last updated. |
Table legend Copied
The table cells display the following data:
| Column Name | Description |
|---|---|
| path | The full XPath text. |
| invocations | Number of times this path was evaluated. |
| time | Total time spent evaluating the path. |
ORB Statistics Copied
The ORB (Object Request Broker) is a central part of each Geneos binary, and is used to transfer information from the Netprobe to the Gateway and then on to the Active Console and other components in an efficient way. Almost all work passes through the ORB (an example of an exception to this is the small heartbeats used to ensure other components are up) so the Orb stats category is a good indicator the total work that the gateway is performing. The Component Statistics can then be used to see a higher level view of the parts of the Gateway that are processing this data.
In addition, this view displays statistics relating to conflation which can be used to determine its effectiveness and impact on the gateway.
Headline legend Copied
The headline cells above the table display the following data:
| Name | Description |
|---|---|
| category | The load monitoring statistics category being displayed. |
| grouping | The currently configured grouping mode, if any. |
| statistics | The statistics being displayed. |
| filter | The currently configured filter, if any. |
| lastUpdatedTime | Time the underlying data being displayed was last updated. |
Table legend Copied
The table cells display the following data:
| Column Name | Description |
|---|---|
| conflatedMessagesCreated | The number of outgoing messages created by conflation. A message can contain multiple updates. |
| messagesConflated | The number of incoming messages condensed into conflated messages. A message can contain multiple updates. |
| methodsConflated | The number of individual updates discarded by conflation. |
| conflationTime | The total time spent waiting for conflation to run. This value is included in the time statistic. |
| time | Total time spent processing data. |
Gateway-sql Statistics Copied
The Gateway-sql plugin is a plugin that runs on the Gateway and allows users to produce new dataviews by combining data from existing dataviews on the Gateway. The statistics in the Gateway-sql category show how much work various instances of the plugin are doing.
Headline legend Copied
The headline cells above the table display the following data:
| Name | Description |
|---|---|
| category | The load monitoring statistics category being displayed. |
| grouping | The currently configured grouping mode, if any. |
| statistics | The statistics being displayed. |
| filter | The currently configured filter, if any. |
| lastUpdatedTime | Time the underlying data being displayed was last updated. |
Table legend Copied
The table cells display the following data:
| Column Name | Description |
|---|---|
| totalTime |
The total time spent in the plugin, this includes the time taken to:
|
| searchTime | The time taken to seach the gateway for the items prior to insertion in the database. |
| insertTime | The time taken to insert data into the source tables. |
| queryTime | The time taken to run SQL queries against the source tables |
| extractionTime | The time taken to populate the sampler's dataviews from the query result sets |
| publishTime | The time taken to publish the extracted data into the gateway |
Commands Copied
The underlying statistics for the gateway load monitoring plugin can be controlled by a set of gateway commands. Using these commands, users can dynamically:
- Start statistics collection
- Stop statistics collection
- Reset all cumulative statistics
- Write statistics to file
These commands appear in Active Console when right-clicking on a gateway:
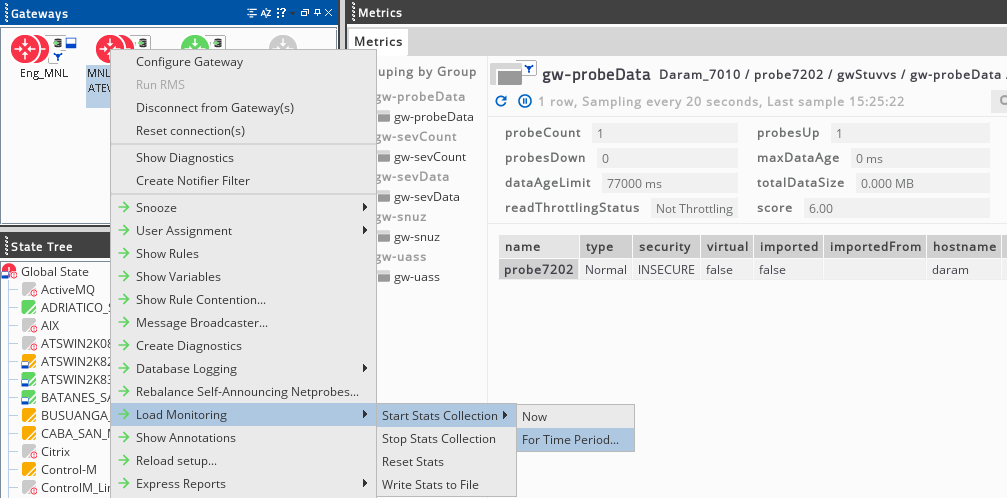
Selecting the “for time period” command produces the following dialog, allowing users to gather statistics over a specified period of time.
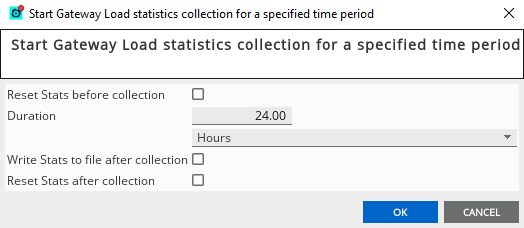
Starting and stopping statistics collection will start and stop the collection in memory, but will also start and stop the periodic logging of statistics to a file, if this has been configured. In addition, starting statistics collection is only possible if a timed collection is not in progress. To cancel a timed collection, simply issue the stop collection command first.
The Reset Stats command will clear any cumulative statistics from memory, i.e. zero any times and number of executions etc. Stats such as the number of matching items will not be reset to zero as they will be valid regardless of the time period monitoring occurs for (assuming no new samplers are (un)configured, or probes started/stopped).
The Write Stats to File command will write the statistics values from memory to disk. This performs the same operation as the regular stats file writing that can be configured, as well as the the “Write Stats to file after collection” option when gathering statistics over a period of time.
Configuration Copied
samplers > sampler > plugin > Gateway-gatewayLoad > maximumNumberOfRows Copied
Maximum number of rows displayed on the dataview. The rows with the highest values for the main statistics are displayed. For most categories, and when the statistics > expandType option is used, this is the “Time” or “TotalTime” column. For connection statistics, it is the sum of “ReceiveRate” and “SendRate”. When a single statistic is shown for multiple features, that statistic is summed across the features.
The performance of the Gateway may be affected if this setting is increased significantly above the default value.
Mandatory: No
Default: 200
Note
You can override this setting with a Gateway-wide row limit that you can configure in the Gateway Setup Editor under Operating environment > Custom dataview max rows.
samplers > sampler > plugin > Gateway-gatewayLoad > view > category Copied
Specifies the category of statistics to display:
- Gateway-sql statistics
- Component statistics
- Connection statistics
- Directory statistics
- Gateway plugin statistics
- ORB statistics
- XPath statistics
Mandatory: Yes
samplers > sampler > plugin > Gateway-gatewayLoad > view > source > file Copied
The file data source specifies that the plugin should display load data as read from a file. This file should have previously been logged by a gateway using the “Write stats to file” operating environment settings.
The file will be read if it has been updated since the last sample. Reading a very large statistics file may take several seconds. The results are cached across all Gateway Load samplers reading the file, so the amount of Gateway processing allocated to reading the file is affected by the shortest sample interval of those samplers. If a file that takes 12 seconds to read is updated and sampled every 10 seconds, the Gateway will become unresponsive.
Mandatory: No
Default: If not specified, the plugin reads data from gatewayInternals source.
samplers > sampler > plugin > Gateway-gatewayLoad > view > source > gatewayInternals Copied
This data source specifies the plugin should display data currently being gathered by the gateway, and read from gateway memory.
Mandatory: No.
Default: If not specified, the plugin reads data from gatewayInternals source.
samplers > sampler > plugin > Gateway-gatewayLoad > view > category > componentStats > grouping Copied
The grouping level at which to view the statistics. Each row in the resulting view will be a group at the grouping level. For example, grouping by ThreadID means that each row in the output view relates to a particular thread.
Mandatory: No
Default: Grouping by component
samplers > sampler > plugin > Gateway-gatewayLoad > view > category > componentStats > statistics > expandType Copied
Displaying statistics by expanded type will show only the stats values for that type. For example, selecting “Rules” will show all rule statistical values with a separate column for each value. Values for other types will not be displayed.
Mandatory: No
Default: No expansion, time statistics will be shown.
samplers > sampler > plugin > Gateway-gatewayLoad > view > category > gatewayPluginStats > filtering > filter Copied
This setting applies an inclusive filter to the statistics before display, showing only items that match the filter in the resulting view.
Filtering can be performed on:
- Managed Entity
- Plugin
- Probe
- Rule
- Sampler
- Type
- Database item
Mandatory: No
Default: No filtering
samplers > sampler > plugin > Gateway-gatewayLoad > view > category > gatewayPluginStats > grouping Copied
The grouping level determines how the statistics are displayed. Each row in the resulting view represents a group at the chosen level. For example, grouping by Managed Entity means that each row in the output view relates to an entity.
You can apply up to two levels of grouping, allowing a top-level grouping with sub-groups at the second configured level.
Mandatory: No
Default: Managed Entity
samplers > sampler > plugin > Gateway-gatewayLoad > view > category > directoryStats > filtering > filter Copied
This setting applies an inclusive filter to the statistics before display. Only items matching the filter will be shown in the resulting view.
Filtering can be performed on:
- Managed Entity
- Plugin
- Probe
- Rule
- Sampler
- Type
- Database Item
Mandatory: No
Default: No filtering
samplers > sampler > plugin > Gateway-gatewayLoad > view > category > directoryStats > grouping Copied
The grouping level at which to view the statistics. Each row in the resulting view will be a group at the grouping level. For example, grouping by Managed Entity will means that each row in the output view relates to an entity.
Up to two levels of grouping can be applied, to display a top-level grouping with sub-groups of the second configured level.
Mandatory: No
Default: Managed Entity
samplers > sampler > plugin > Gateway-gatewayLoad > view > category > directoryStats > statistics > perType Copied
This setting controls which statistics to display. Statistics from a feature matching the selected type will be shown, with the column as the name of the type.
For example, displaying perType with “matchingItems” will show columns where the values are counts of matching items. The names of these columns will be the feature names, i.e. rules and dbLogging.
Mandatory: No
Default: Time
samplers > sampler > plugin > Gateway-gatewayLoad > view > category > directoryStats > statistics > expandType Copied
Displaying statistics by expanded type will show only the stats values for that type. For example, selecting “Rules” will show all rule statistical values with a separate column for each value. Values for other types will not be displayed.
Mandatory: No
Default: If not specified, the plugin will display a perType Time statistic.
samplers > sampler > plugin > Gateway-gatewayLoad > view > category > xpathStats > filter > method Copied
Filters the XPath statistics output to view, by the internal gateway method-call used to evaluate the path.
Mandatory: No
Default: All methods are summarised into a single figure
| Value | Meaning |
|---|---|
| getItems | Called by the gateway to resolve a path to a set of items. |
| getRelativeItems | Called to resolve a relative path against a specific item, to a set of items. |
| nameAppliesToDataItem | Called to reverse-resolve an item against a path (e.g. during rule lookups on initial item creation). |
Includes data Copied
samplers > sampler > plugin > Gateway-includesData Copied
The plugin monitors the include files that are currently configured on this Gateway.
Table legend Copied
The table cells display the following data:
| Column Name | Description |
|---|---|
| priority | The configured priority of the include file. |
| file | The location of the include file (or main setup file) as specified on the Gateway. |
| applied | The time when this file was read from disk and applied by the Gateway. If the file could not be applied this is noted here along with applicable error message. |
| changed | The time when this file last changed on disk. If the file cannot be reached to check the changed time, a “path inaccessible” message is displayed. |
| activeMd5Sum | This is the MD5 sum of the include file that is currently active. This will be different from the MD5 sum of the include file on disk in the following cases:
|
| activeVersion | This is version number of the active include file as returned by the post-validate hook. See Post Setup Apply. |
| lastEditedBy | The name of the user who last edited the file. |
| LastEditedGateway | The name of the Gateway the user was authenticated with when the file was last edited. Not recorded if using an unauthenticated Gateway. |
| LastEditedOnWorkstation | The name of the machine the user was logged into when the file was last edited. |
| resourceID | Numeric resourceID of the resource stored in the Gateway Hub. It is only displayed if the Gateway is HubEnabled. |
| activeGatewayHubVersion | Gateway Hub version of the resource that is currently used by the Gateway. It is only displayed if the Gateway is HubEnabled. |
Imported data Copied
samplers > sampler > plugin > Gateway-importedData Copied
Table legend Copied
The table cells display the following data:
| Column Name | Description |
|---|---|
| name | The name of this connection. |
| connectionStatus | The status of the connection. This can be one of; |
| providedDataSets | The list of data sets that have actually been provided to the importing Gateway. |
| requestedDataSets | The list of data sets that the importing Gateway has requested. |
| gatewayName | The name of the exporting Gateway. |
| primaryHost | The host of the Gateway that data is being imported from. (This is the primary host if the Gateways are in a hot standby pair). |
| primaryPort | The port of the Gateway that data is being imported from is listening on. (This is the primary host if the Gateways are in a hot standby pair). |
| secondaryHost | The host of the secondary Gateway that data is being imported from. |
| secondaryPort | The port of the secondary Gateway that data is being imported from is listening on. (This is the primary host if the Gateways are in a hot standby pair). |
| security | Whether the Gateway has connected to the exporting Gateway using a secure or insecure connection. |
| conflictingProbes | A comma separated list of probes that have been dropped from the imported data sets because they conflict with existing probes in the importing Gateway. See Conflict Resolution. |
ITRS Analytics Connection Copied
The ITRS Analytics Connection plugin monitors the current configuration and state of the Gateway connection to ITRS Analytics. The plugin has three dataviews:
- Summary
- Data Access
- Detail
Summary dataview Copied
The Summary dataview provides an overview of publishing from the Gateway to ITRS Analytics.
Table legend Copied
| Column Name | Description |
|---|---|
| byteRate | Bytes per second published to ITRS Analytics, summed over all message types shown in Detail view. |
| connectionStatus | Indicates the status of the gRPC connection to ITRS Analytics. This has the following possible values:
|
| dataviewsPublished | Number of dataviews that are published to ITRS Analytics. |
| dataviewsUnpublished | Number of dataviews that are not published to ITRS Analytics because publishing has been disabled in the Gateway configuration. |
| dataviewsWithErrors | Number of dataviews that are not published due to lack of sampler schema or incomplete sampler schema. |
| enabled | Indicates whether the ITRS Analytics connection is enabled. |
| ingestionEndpoint | ITRS Analytics publishing endpoint. |
| messageRate | The rate at which messages are sent to ITRS Analytics, measured as the number of messages per second. |
| messagesDroppedPerSample | Number of messages dropped in the last sample. |
| metricsChanged | Number of schemaless metrics which have been published as one type (String, Number, DateTime), and subsequently the type published has changed to a different type. |
| metricsDropped | Number of metrics which have been dropped due to type mismatches between data in the Geneos cells and their schema definition of data to publish. |
Data Access dataview Copied
The Data Access dataview describes each configured ITRS Analytics data access service.
Table legend Copied
| Column Name | Description |
|---|---|
| name | Configured service display name or the dataEndpoint value when no name is set. |
| dataEndpoint | ITRS Analytics data access endpoint. |
| accessTokenUser | ITRS Analytics user name for Active Console data requests. |
| accessTokenAvailable | Indicates whether an access token is available. Active Console requires this token to access historical data from ITRS Analytics. |
| subscribedToCommands | Indicates whether the Gateway is subscribed to command execution for that service. |
Detail dataview Copied
The detail dataview shows separate message statistics for the different types of messages that may be published.
Table legend Copied
| Column Name | Description |
|---|---|
| name | The message type. Possible values include:
|
| sendState | The current state of the queue for the message type. Possible values include:
|
| deliveryStatus | The delivery status of the last message batch sent. Possible values include:
|
| byteRate | Bytes per second published to ITRS Analytics for this type of message. |
| messageRate | The rate at which messages are sent to ITRS Analytics, measured as the number of messages per second. |
| maxBufferSize | Configured maximum number of messages that can be buffered. |
| messagesInBuffer | Number of messages buffered in the queue for the message type. |
| messagesDroppedPerSample | Number of messages dropped in the last sample. |
Show Dataviews Command Copied
The Show Dataviews command is available by right-clicking on the cell values in the following rows and navigating to > Show Dataviews:
- dataviewsPublished
- dataviewsUnPublished
- dataviewsWithErrors
The command opens a new window that shows a table identifying the dataviews contributing to the count in that cell.
The table has the following columns:
- Managed Entity
- Sampler
- Type
- Dataview
Licence usage Copied
samplers > sampler > plugin > Gateway-licenceUsage Copied
The Licence Usage plugin monitors the Licence Daemon currently connected to the Gateway. It shows how the licence is in use and how much of the licence is still available as well as the connection status and licence expiry time.
By default, a view will be shown for all licensing groups configured on the gateway
See the Licence Daemon documentation for more information about how to use the plugin to monitor licence usage.
samplers > sampler > plugin > Gateway-licenceUsage > groups Copied
Specifies which licensing groups configured on the daemon the plugin should display views for. By default, a view will be shown for all licensing groups configured on the gateway.
Mandatory: No
samplers > sampler > plugin > Gateway-licenceUsage > groups > group Copied
The name of a licensing group configured on the daemon that the plugin should display a view for.
Mandatory: No
samplers > sampler > plugin > Gateway-licenceUsage > showOverall Copied
Display a view showing the overall ITRS issued licence and how it is being used.
Mandatory: No
Default: false
samplers > sampler > plugin > Gateway-licenceUsage > showOther Copied
Display a view showing how any tokens not allocated to a licensing group are being used.
Mandatory: No
Default: false
Managed entities data Copied
samplers > sampler > plugin > Gateway-managedEntitiesData Copied
The plugin monitors the Managed Entities whose data is being monitored via this Gateway. This plugin has two dataviews:
- Summary dataview
- Entities dataview
Entities Summary dataview Copied
This dataview provides the following properties:
| Name | Description |
|---|---|
| managedEntityCount | Number of ManagedEntities configured on this gateway. |
| undefinedCount | Number of configured ManagedEntities that have a runtime severity of undefined. |
| okCount | Number of configured ManagedEntities that have a runtime severity of ok. |
| warningCount | Number of configured ManagedEntities that have a runtime severity of warning. |
| criticalCount | Number of configured ManagedEntities that have a runtime severity of critical. |
Entities Details dataview Copied
The dataview provides details on each entity being monitored by the Gateway.
| Column Name | Description |
|---|---|
| name | The unique name configured for this managed entity. |
| severity |
The runtime severity of this managed entity. Note: If a Managed Entity is imported, this value is affected by severity and snooze data imported from Managed Entity's source Gateway, as well as any severity and snooze data generated by this Gateway. |
| probeName | The name of the probe this managed entity references. |
| probeStatus | The connectionState of the probe this managed entity references. |
| samplerCount | The number of samplers configured on this managed entity. |
| samplerNames |
The name of the samplers configured on this entity. |
| attributes | The attribute name value pairs for this entity. |
| dataviewCount | The number of dataviews in this managed entity. |
| maxCellCount | The number of cells in the dataview in this managed entity that has the most cells. |
samplers > sampler > plugin > Gateway-managedEntitiesData > mode Copied
Mode can either be Summary Only or Summary And Details. If Summary Only is selected then only the Summary dataview is generated by the plugin, otherwise both dataviews are generated.
Mandatory: No
Default: Summary Only
Performance Copied
samplers > sampler > plugin > Gateway-performance Copied
The Gateway-performance plugin provides comprehensive monitoring on the Gateway system performance. It collects real-time metrics on CPU usage, memory consumption, threading, data flow, and storage utilization.
The plugin creates a single dataview with a two-column table containing performance metrics:

Note
The plugin uses adaptive metric display. Only successfully collected metrics appear in the dataview. If a metric cannot be collected due to permission issues, unavailable system information, or transient failures, it will not be shown.
- Review the
GatewayPerformancemodule in the Gateway logs to identify specific collection failures.- Missing metrics do not affect the collection or display of other metrics.
The plugin is fully supported in Linux platforms using the /proc filesystem. Ensure that the Gateway process has permissions to read the /proc filesystem and access disk information. On non-Linux platforms, the plugin runs with limited functionality where some metrics may not be available.
Performance metrics Copied
The following metrics are reported in the dataview based on system availability:
| Category | Metric | Description |
|---|---|---|
| System | cpuUsage |
Gateway process CPU usage as percentage of CPU core capacity. This metric measures only the Gateway process CPU consumption, not the total system CPU usage. The value can exceed 100% on multi-core systems when the process uses multiple cores. Format: Availability: May not display during first measurement or if |
| System | residentSetSize |
Physical memory (RAM) currently used by the Gateway process. Format: Source: VmRSS from Availability: If |
| Threading and Processing | numberOfRuleThreads |
Number of rule evaluation threads configured. Format: Integer (for example, Availability: Always available (from |
| Threading and Processing | numberOfGatewayThreads |
Total number of threads used by the Gateway process. Format: Integer (for example, Source: Threads from Availability: If |
| Data Management | maxDataAge |
Maximum age threshold for live data. Format: Availability: Always available (from |
| Data Management | numberOfSuspendedProbes |
Count of probes currently in the Format: Integer (for example, Source: Real-time data from the Availability: Always available when |
| Data Management | dataQueueSize |
Total size of data queues across all connections. Format: Availability: If ORB connection quality information is available. |
| System Resources | numberOfFileDescriptors |
Number of file descriptors currently in use. Format: Integer (for example, Source: Count of entries in Availability: If |
| Storage Monitoring | dataDirectorySpaceAvailable |
Available disk space in the data directory. Format: Availability: If disk space can be successfully measured for the data directory. |
| Storage Monitoring | workingDirectorySpaceAvailable |
Available disk space in the current working directory. Format: Availability: If disk space can be successfully measured for the working directory. |
| Storage Monitoring | logSpaceAvailable |
Available disk space on the log file drive. Format: Availability: If a log file is configured and the disk space can be measured. |
| Application | totalCellCount |
Total number of cells managed by the Gateway. The count is based on all dataviews that exist at the time of sampling and includes headlines, the Table row names are not included in this count. |
Probe data Copied
samplers > sampler > plugin > Gateway-probeData Copied
The plugin monitors the probes whose data is being monitored via this Gateway. This plugin has two dataviews:
Netprobe dataview Copied
This may include:
- Normal probes (configured in the setup)
- Virtual probes (configured in the setup)
- Floating probes (configured in the setup)
- Self-announcing probes (self-announced itself to the Gateway)
- Imported probes (imported from an exporting Gateway dataset)
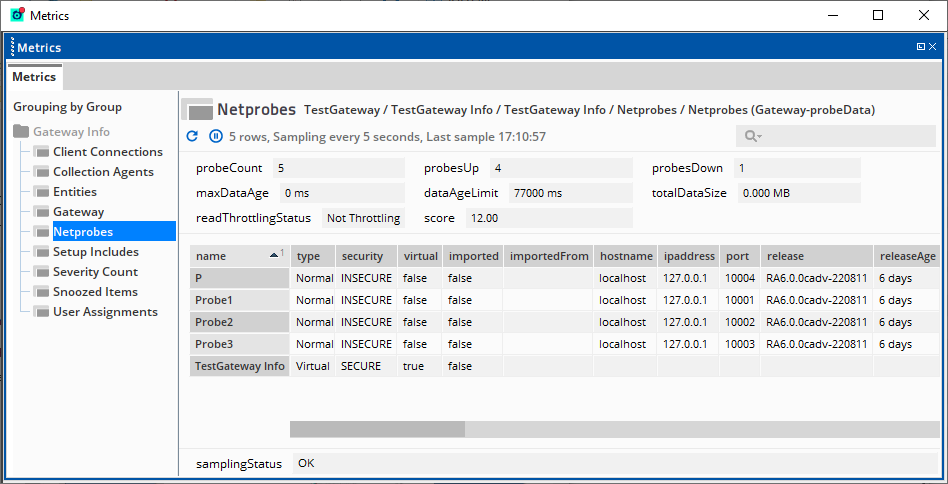
This view also contains select data quality statistics applicable to probes. These statistics are generated internally to gateway and update approximately every 5 seconds. Therefore, depending upon the sampling rate configured you may not see a different value every sample.
The data quality statistics “freeze” for a probe which has been suspended by the data quality algorithm, so that the last known values for the probe are available for viewing. These values are ignored for statistical calculations, so figures in, for example, the gatewayLoad column are expected to sum to greater than 100% in this circumstance.
Headline legend Copied
The headline cells above the table display the following data:
| Name | Description |
|---|---|
| probeCount | Number of probes configured on this Gateway. |
| probesUp | Number of probes that have a connectionState UP. |
| probesDown | Number of probes that have a connectionState other than up. |
| maxDataAge | Age of the oldest (pending) data update in milliseconds. |
| dataAgeLimit | Configured maximum age. If maxDataAge reaches or exceeds this limit, the data quality algorithm may take steps to reduce Gateway load to improve data quality. |
| totalDataSize | Estimated size of the unprocessed (pending) data in the data-queues. In megabytes. |
| readThrottlingStatus | Status of the TCP read throttling algorithm that protects the data-queues from unbounded growth when the Gateway is overloaded. Can be one of four values:
|
| score | Current Gateway score. This is the total score from normal, virtual, floating, and self-announcing Netprobes. The included SANs are either currently connected or were connected to the Gateway and have not been dropped from the live setup due to timeouts. See Score. |
Table legend Copied
The table cells display the following data:
| Column Name | Description |
|---|---|
| name | Unique name configured for this probe. |
| type | Type of probe. This can be one of four values:
|
| security | Whether the probe has connected to its Gateway using a secure or insecure connection. |
| virtual | Whether the probe is virtual of not (true/false) |
| imported | Whether the probe is imported from another Gateway. |
| importedFrom | Name of the exporting Gateway from which this probe is imported (if it is imported; blank if otherwise) |
| hostname | Hostname configured for this probe. |
| ipaddress | IP address resolved from the hostname for this probe. |
| port | Port configured for this probe. |
| release | Release version of this probe. |
| releaseAge | Time in days since the probe version was created. |
| schemaVersion | Version number of the schema published by this probe. |
| severity | Runtime severity of this probe. |
| connectionState | Connection state of this probe. One of:
|
| OS | Operating system type of the connected Netprobe. |
| managedEntityCount | Number of ManagedEntities configured on this probe. |
| support | Features supported by this probe version. |
| score | Score added to the Gateway by the probe. See Score. |
| gatewayLoad | Load on the Gateway caused by processing data from the probe, as a percentage against all other probes. This figure can help to identify “busy” Netprobes. |
| busiestView | View which is contributing most to the gatewayLoad figure for that probe. |
| busiestViewLoad | Load of the busiestView, as a percentage against all other views on that probe. |
| sslCertificateDaysRemaining | Indicates the number of days remaining before the SSL Certificate of a Netprobe expires.
|
Optional columns:
| Column Name | Description |
|---|---|
| user |
This column will be available if the setting processAttributes has been set to "byName". This is the default value for the setting. The cell will contain the user name of the account that is running the Netprobe. The Netprobe must be at least version GA3.0.20-140610 to support this feature. If the Netprobe does not support this feature then the cell will be blank. |
| group |
This column will be available if the plugin setting processAttributes is set to "byName". This is the default for the setting. The cell will contain the name of all groups that the account that is running the Netprobe belongs to. The Netprobe must be at least version GA3.0.20-140610 to support this feature. If the Netprobe does not support this feature then the cell will be blank |
| uid |
This column will be available if the plugin setting processAttributes is set to "byID". The cell will contain the user id of the account that is running the Netprobe. The Netprobe must be at least version GA3.0.20-140610 to support this feature. If the Netprobe does not support this feature then the cell will be blank Windows probes do not support IDs for users so this cell will be blank for windows probes. |
| gids |
This column will be available if the plugin setting processAttributes is set to "byID". The cell will contain the ids of all groups that the account that is running the Netprobe belongs to. The Netprobe must be at least version GA3.0.20-140610 to support this feature. If the Netprobe does not support this feature then the cell will be blank Windows probes do not support IDs for groups so this cell will be blank for windows probes. |
| TRUSTED_API_HOSTS |
This column will be available if "TRUSTED_API_HOSTS" is selected under the plugin attributes setting. The cell will contain the value of the TRUSTED_API_HOSTS environment variable provided to the Netprobe at start-up. The Netprobe must be at least version GA3.0.20-140610 to support this feature. |
| TRUSTED_DEBUG_HOSTS |
This column will be available if "TRUSTED_DEBUG_HOSTS" is selected under the plugin attributes setting". The cell will contain the value of the TRUSTED_DEBUG_HOSTS environment variable provided to the Netprobe at start-up. The Netprobe must be at least version GA3.0.20-140610 to support this feature. |
| TRUSTED_HTTP_HOSTS |
This column will be available if "TRUSTED_HTTP_HOSTS" is selected under the plugin attributes setting". The cell will contain the value of the TRUSTED_HTTP_HOSTS environment variable provided to the Netprobe at start-up. The Netprobe must be at least version GA3.0.20-140610 to support this feature. |
| TRUSTED_GATEWAY_HOSTS |
This column will be available if "TRUSTED_GATEWAY_HOSTS" is selected under the plugin attributes setting". The cell will contain the value of the TRUSTED_GATEWAY_HOSTS environment variable provided to the Netprobe at start-up. The Netprobe must be at least version GA3.0.20-140610 to support this feature. |
| TRUSTED_GATEWAY_NAMES |
This column will be available if "TRUSTED_GATEWAY_NAMES" is selected under the plugin attributes setting". The cell will contain the value of the TRUSTED_GATEWAY_NAMES environment variable provided to the Netprobe at start-up. The Netprobe must be at least version GA3.0.20-140610 to support this feature. |
Note
The security value for an imported probe cannot be trusted to guarantee a secure connection to the importing Gateway. The importing connection should also be checked. Theseverityvalue reported in this dataview reflects the severity of each probe, thus if a probe is imported, the value will be affected by severity and snooze data imported from probes’ source gateway as well as any severity and snooze data generated by this gateway on the probe.
Collection Agent dataview Copied

Note
Rows in the Collection Agents dataview will not disappear even if the Netprobe goes down.
Commands Copied
The following commands are available in the Collection Agent dataview:
- View Log
- View Configuration
- View Error
The View Log and View Configuration commands are also available when you right-click the following in the State Tree:
- Netprobes with configured Dynamic Entities
- Dynamic Managed Entities
- Dynamic Entity Health samplers
View Log Copied
This command shows the logs of the corresponding Collection Agent of the selected cell. When you right-click on any cell except for the probeName, and select theCollection Agent > View Log… option, a dialog box will open to specify options on how you want to view the logs.

The following parameters can be set:
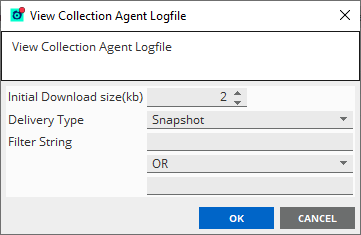
- Initial Download size(kb) — sets the initial download size of the log file. This defaults to
2kb. - Delivery Type — allows you to choose between
SnapshotandContinuousdelivery type. The snapshot delivery type displays the contents of the log file at the time it was generated, while continuous delivery type displays logs continuously in real-time. - Filter String — allows you to specify strings that will filter the Collection Agent log file.
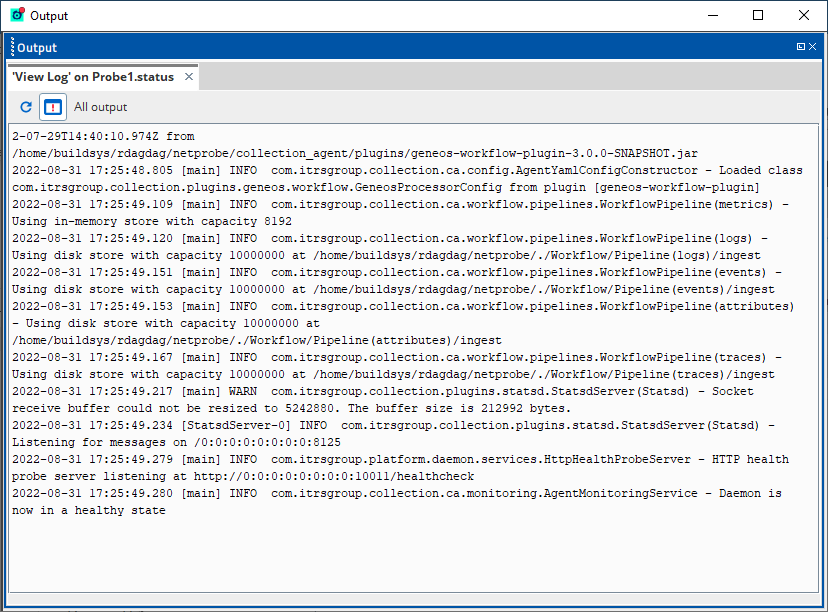
Sample Output (Snapshot delivery type) Copied
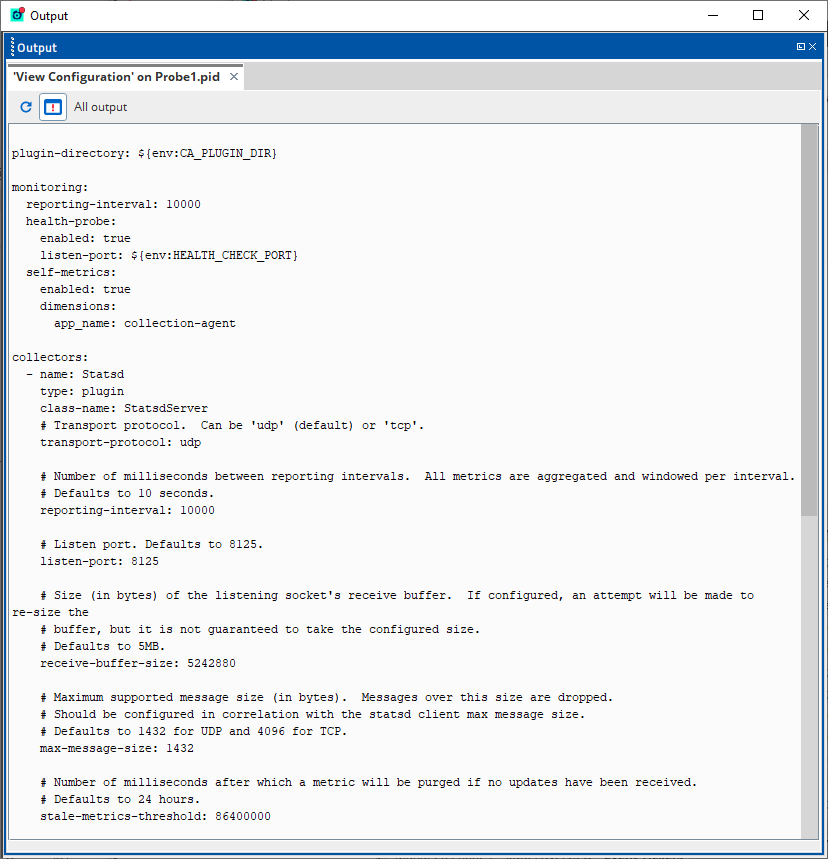
View Configuration Copied
When you right-click on any cell except for the probeName, and select theCollection Agent > View Configuration option, a new window displaying the configuration of the corresponding Collection Agent will open.

Sample Output Copied
View Error Copied
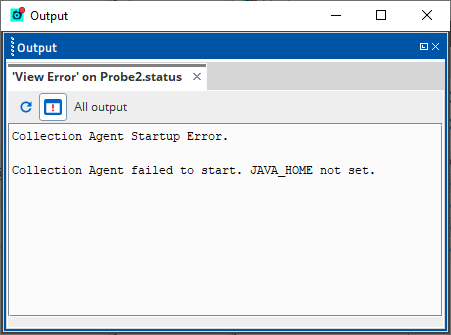
When you right-click on a cell in the status column, and select theCollection Agent > View Error option, a new window displaying more inforopen.

Sample Output Copied
| Name | Description |
|---|---|
| probeName | Name of the Netprobe.
|
| mode | Describes whether the Collection Agent is managed or unmanaged by the Netprobe. For more configuration information, see Collection Agent in Dynamic Entities. |
| status | Status of the Collection Agent. The possible values are the following:
|
| secureConnection | Describes whether the connection between the Netprobe and the Collection Agent is secure or not. Value is either true or false. |
| pid | Displays the process ID of the Collection Agent managed by the Netprobe. If the Collection Agent is not managed by the Netprobe, then this column value is empty. |
| numberOfRestarts | Number of restarts the Netprobe has had to perform on the Collection Agent. |
| entityCount | Number of Dynamic Entities in the Collection Agent. |
| samplerCount | Number of samplers in the Collection Agent. |
| rejectedEntityCount | Number of rejected Dynamic Entities in the Collection Agent. |
| rejectedSamplerCount | Number of rejected samplers in the Collection Agent. |
| metricCount | Number of different metric datapoints that are mapped to cells. |
| invalidMetricCount | Number of different metric datapoints that cannot be mapped to cells. |
| streamsCount | Number of different metric datapoints that are mapped to Geneos streams and monitored by the FKM or the State Tracker plugin. |
| invalidStreamsCount | Number of different metric datapoints that are either of the following:
|
samplers > sampler > plugin > Gateway-probeData > processAttributes Copied
This setting defines how the process context of the Netprobe should be shown. The process context is the account run the Netprobe process. The plugin displays the user and group information for this account. If the value of this setting is “byName” then the user and group names of the account will be shown in columns user and groups. If the value of this setting is “byID” then the user id and group ids will be shown in columns uid and gids.
Note
Windows probes do not support ids for groups and users, so the uid and gids cells will be blank for windows probes.
These settings require a probe whose version is newer than GA3.0.20-140610. If the Netprobe is older the cells will be blank.
Mandatory: No
Default : byName
samplers > sampler > plugin > Gateway-probeData > attributes Copied
This setting allows the administrator to add a set of environment variables used by the Netprobe to the sampler. Currently the following environment variables are supported:
- TRUSTED_API_HOSTS
- TRUSTED_DEBUG_HOSTS
- TRUSTED_HTTP_HOSTS
- TRUSTED_GATEWAY_HOSTS
- TRUSTED_GATEWAY_NAMES
New columns will be added to the sampler with the names of the environment variables selected. These settings require a probe whose version is newer than GA3.0.20-140610. If the Netprobe is older the cells will be blank. If an environment variable is selected from the above list then the default value for the selected environment variable will be a “+” sign.
Mandatory: No
Default: No environment variables selected
Scheduled command data Copied
samplers > sampler > plugin > Gateway-scheduledCommandData Copied
The plugin monitors currently configured Scheduled Commands and present information about their configuration, current, past and future scheduled runs. The plugin has no configuration settings.
Dataview Copied
Below is a snapshot of how the plugin dataview might look:

Headline legend Copied
The headline cells above the table display the following data:
| Name | Description |
|---|---|
| configuredCommandsCount | Number of Scheduled Commands that are currently configured. |
| runningCommandsCount | Number of Scheduled Commands that are currently running. |
| scheduledCommandsCount | Number of Scheduled Commands which are scheduled for future run. |
Table legend Copied
The table cells display the following data:
| Column Name | Description |
|---|---|
| command | The name of Scheduled Command. |
| recurrenceInterval | How often the Scheduled Command is run? This data will make sense in conjunction with 'recurrencePeriod' |
| recurrencePeriod | The recurrence period for the Scheduled Command. It will have values - minutes, hours, days, weeks, weekdays, months. |
| activeTime | The Active Time (if any) associated with the Scheduled Command. |
| running | Whether the Scheduled Command is currently running. Possible values: 'YES', 'NO' |
| runningTimestamp | Start time of currently running instance (if any), <blank> otherwise. |
| runningTargetCount | The number of targets against which the Scheduled Command is running (if it is currently running), <blank> otherwise |
| scheduled | Whether the Scheduled Command is scheduled to run in future. Possible values: 'YES', 'NO' |
| scheduledState | Whether the next scheduled run will be inside or outside the Active Time. Possible values: 'Active', 'Not Active' |
| scheduledTimestamp | Start time of next run (if scheduled), <blank> otherwise. |
| scheduledTargetCount | The number of targets against which the Scheduled Command is scheduled to run next. This count will be if the command was run at the time the data view is sampled. |
| lastRunTimestamp | Start time of last run instance of Scheduled Command (if any). |
| lastRunTargetCount | The number of targets against which the Scheduled Command ran last time. |
| lastRunFailedTargetCount | The number of targets against which the Scheduled Command failed to run last time. |
Points to Note:
- Column
scheduledState‘Not Active’ value denotes that the scheduled run will not occur as it will be outside the active time (as the Active Time state at that scheduled time will be Not Active or Override). Similarly, ‘Active’ value denotes that the scheduled run will occur as it will be inside active time. Scheduled Commands with no configured ‘Active Time’ but a scheduled run will always display ‘Active’ for this column. - ‘weekDays’ recurrencePeriod will denote that user has configured everyWeekday days recurrence pattern in the setup.
- If the Scheduled Command is not scheduled, it will mean the Scheduled Command had ’endByDate’ or ’endAfterXOccurances’ configured and either the time is past ’endByDate’ or the command has already run X times in the past.
- If the Scheduled Command is not running, it will simply mean the Scheduled Command is not running at that point of time. One cannot infer if it is scheduled to run in future. For that, one will refer to ‘scheduled’ column.
- The timestamps will be displayed in Gateway time zone irrespective of the time zones configured in the individual Scheduled Commands. All the timestamps would be displayed in the format YYYY-MM-DD HH:MM:SS for easy sorting of columns.
Scheduled commands history data Copied
samplers > sampler > plugin > Gateway-scheduledCommandsHistoryData Copied
The plugin monitors the past runs of currently configured Scheduled Commands.
Below is a snapshot of how the plugin dataview might look:
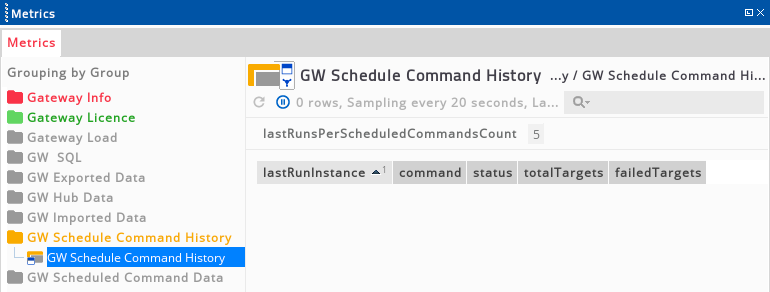
Configuration Copied
samplers > sampler > plugin > Gateway-scheduledCommandsHistoryData > scheduledCommand Copied
The Scheduled Command for which past runs need to be monitored. By default, all configured Scheduled Commands past runs are displayed.
Mandatory: No
samplers > sampler > plugin > Gateway-scheduledCommandsHistoryData > run > last Copied
The number of most recent past runs which need to be displayed. This number is always limited by the history count configured in the Scheduled Command Advanced tab. Refer to this section.
Mandatory: No
Dataview Copied
Headline legend Copied
The headline cells above the table display the following data:
| Name | Description |
|---|---|
| lastRunsPerScheduledCommandsCount | Number of most recent past runs displayed per Scheduled Command. |
Table legend Copied
The table cells display the following data:
| Column Name | Description |
|---|---|
| lastRunInstance | The last run instance of the Scheduled Command. Format: YYYY-MM-DD HH:MM:SS_<commandName> |
| command | The Scheduled Command name (for easy sorting) |
| status | The status of the past run instance. Possible values: 'SUCCESS', 'FAIL'. |
| totalTargets | The number of targets against which the Scheduled Command instance ran. |
| failedTargets | The number of targets against which the Scheduled Command instance failed to run. |
Points to Note:
FAILstatus of the last run instance means the command failed to run on 1 or more expected targets.SUCCESSstatus implies the command ran fine on all targets.- The timestamps would be displayed in Gateway time zone irrespective of the time zones configured on the individual Scheduled Command. All the timestamps would be displayed in the format YYYY-MM-DD HH:MM:SS for easy sorting of columns.
Severity count Copied
samplers > sampler > plugin > Gateway-severityCount Copied
The plugin monitors the number of cells with OK, WARNING, or CRITICAL severities.
Headline legend Copied
The headline cells above the table display the following data:
| Name | Description |
|---|---|
| viewpath | Displays what viewpath elements need to be matched for a managed entity to be considered when generating the dataview |
| filterIn | Displays the inclusive attribute filters. See filter setting. |
| filterOut | Displays the exclusive attribute filters. See filter setting.
|
Table legend Copied
The table cells display the following data:
| Column Name | Description |
|---|---|
| name | Row identifier |
| okItems | Number of ok items. |
| warningItems | Number of warning items |
| criticalItems |
Number of critical items. Note: The `okItems`, `warningItems` and `criticalItems` metrics can be affected by any snooze or severity data that has been imported, as well as any snooze or severity data locally generated. |
samplers > sampler > plugin > Gateway-severityCount > viewPaths Copied
A list of view paths.
Mandatory: No
Default: no path defined
samplers > sampler > plugin > Gateway-severityCount > viewPaths > viewPath Copied
The view path configures the view in which the entities will be ordered in terms of attribute names.
Mandatory: No
Default: no path defined
samplers > sampler > plugin > Gateway-severityCount > includeUserAssigned Copied
Whether to include user assigned cells in the count. Any item that has an assigned user counts for this filter, no matter whether it was assigned on this gateway or the assignment was imported from another gateway.
Mandatory: No
Default: true
samplers > sampler > plugin > Gateway-severityCount > includeSnoozed Copied
Whether to include snoozed cells in the count. Any item that has been snoozed counts for this filter, no matter whether it was assigned on this gateway or the assignment was imported from another gateway.
Mandatory: No
Default: false
samplers > sampler > plugin > Gateway-severityCount > includeInactive Copied
Whether to include inactive cells in the count.
Mandatory: No
Default: false
samplers > sampler > plugin > Gateway-severityCount > appendManagedEntity Copied
Whether to drill down to managed entity level.
Mandatory: No
Default: false
samplers > sampler > plugin > Gateway-severityCount > filterByAttribute Copied
A set of one or more filters which can be used to limit the number of managed entities that contribute data to the sampler’s dataview. Each filter is applied in order and a managed entity needs to be accepted by all the filters in order to contribute data.
Mandatory: No
Default: no filters
samplers > sampler > plugin > Gateway-severityCount > filterByAttribute > include Copied
This setting defines a filter on an individual attribute. Any managed entities that have the specified attribute defined in the filter with a value that matches one of the values provided in the filter is accepted by this filter. Any other managed entity is rejected by this filter.
samplers > sampler > plugin > Gateway-severityCount > filterByAttribute > include > name Copied
Name of the managed entity attribute tested by this filter.
samplers > sampler > plugin > Gateway-severityCount > filterByAttribute > include > values Copied
Values of the managed entity attribute that is used by the filter to accept/reject managed entities from contributing data to the sampler’s dataview. Managed entities whose specified attribute matches one of the listed values will be accepted by the filter. If the attribute is not specified on the managed entity or the specified attribute does not match one of the values provided it will be rejected by the filter.
samplers > sampler > plugin > Gateway-severityCount > filterByAttribute > exclude Copied
This setting defines a filter on an individual attribute. Any managed entities that have the specified attribute defined in the filter with a value that matches one of the values provided in the filter is rejected by this filter. Any other managed entity is accepted by this filter.
samplers > sampler > plugin > Gateway-severityCount > filterByAttribute > exclude > name Copied
Name of the managed entity attribute tested by this filter.
samplers > sampler > plugin > Gateway-severityCount > filterByAttribute > exclude > values Copied
Values of the managed entity attribute that is used by the filter to accept/reject managed entities from contributing data to the sampler’s dataview. Managed entities whose specified attribute matches one of the listed values will be rejected by the filter. If the attribute is not specified on the managed entity or the specified attribute does not match one of the values provided it will be accepted by the filter.
samplers > sampler > plugin > Gateway-severityCount > filterAttributes Copied
A set of one or more filters which exclude managed entities from being considered if they contain attributes whose name and value match any of the filters defined here.
Mandatory: No
Default: no filters
Deprecated: See filterByAttribute setting.
Severity data Copied
samplers > sampler > plugin > Gateway-severityData Copied
The plugin monitors and displays details of all cells with WARNING or higher severity. The plugin can be configured to monitor a subset of the cells by filtering the output by Managed Entity.
Headline legend Copied
The headline cells above the table display the following data:
| Name | Description |
|---|---|
| warningItems |
Number of warning items displayed in dataview. |
| criticalItems |
Number of critical items displayed in dataview. |
| filterIn | Displays the inclusive attribute filters. See filter setting. |
| filterOut | Displays the exclusive attribute filters. See filter setting. |
| stateFilter |
Indicates which of the following settings are filtering the dataview:
The format is If no include options are enabled, only included severity is shown. For example, |
Table legend Copied
The table cells display the following data:
| Column Name | Description |
|---|---|
| id | Unique identifier for this cell. |
| componentType | The directory component type of this DataItem. Example: Cell. |
| probe | The probe for this DataItem. |
| managedEntity | The managed entity for this DataItem. |
| sampler | The sampler for this DataItem. |
| dataView | The dataview for this DataItem. |
| cell | The cell for this DataItem. |
| type | The configured sampler type for this DataItem. |
| plugin | The configured plugin type for this DataItem. |
| severity | The severity for this DataItem (Warning/Critical). |
| snoozed | Whether this DataItem is snoozed (true/false). |
| userassigned | Whether this DataItem is assigned to a user (true/false). |
| active |
Whether this DataItem is active (true/false). Note: The `severity`, `snoozed`, `userassigned` and `active` values reported in this dataview reflects the values currently on the cell, thus it is affected by data imported from other gateways as well as data generated on this gateway. |
| timestamp | The time the most recent severity change (Warning/Critical) for this DataItem occurred. |
Note
For the timestamp metric, time is updated when severity is first logged by the gateway and when severity changes between Warning/Critical states.
Active and snooze state changes do not affect the timestamp. Timestamp values for imported severities are created at the time they are imported, not when they occurred on the originating gateway.
samplers > sampler > plugin > Gateway-severityData > filter Copied
This setting is used to filter the cells listed in the plugin. The cells are filtered by ManagedEntity. If the setting is not present then all assigned cells on the gateway will be listed, unless they are filtered by one of other filter setting [includeUserAssigned, includeSnoozed or includeInactive]
Mandatory: No
samplers > sampler > plugin > Gateway-severityData > filter > useAncestorManagedEntity Copied
If this setting is present then the sampler will only display critical and warning labelled cells that are descendants of the managed entity to which the sampler belongs.
samplers > sampler > plugin > Gateway-severityData > filter > filterByAttribute Copied
A set of one or more filters which can be used to limit the number of managed entities that contribute data to the sampler’s dataview. Each filter is applied in order and a managed entity needs to be accepted by all the filters in order to contribute data.
samplers > sampler > plugin > Gateway-severityData > filter > filterByAttribute > include Copied
This setting defines a filter on an individual attribute. Any managed entities that have the specified attribute defined in the filter with a value that matches one of the values provided in the filter is accepted by this filter. Any other managed entity is rejected by this filter.
samplers > sampler > plugin > Gateway-severityData > filter > filterByAttribute > include > name Copied
Name of the managed entity attribute tested by this filter.
samplers > sampler > plugin > Gateway-severityData > filter > filterByAttribute > include > values Copied
Values of the managed entity attribute that is used by the filter to accept/reject managed entities from contributing data to the sampler’s dataview. Managed entities whose specified attribute matches one of the listed values will be accepted by the filter. If the attribute is not specified on the managed entity or the specified attribute does not match one of the values provided it will be rejected by the filter.
samplers > sampler > plugin > Gateway-severityData > filter > filterByAttribute > exclude Copied
This setting defines a filter on an individual attribute. Any managed entities that have the specified attribute defined in the filter with a value that matches one of the values provided in the filter is rejected by this filter. Any other managed entity is accepted by this filter.
samplers > sampler > plugin > Gateway-severityData > filter > filterByAttribute > exclude > name Copied
Name of the managed entity attribute tested by this filter.
samplers > sampler > plugin > Gateway-severityData > filter > filterByAttribute > exclude > values Copied
Values of the managed entity attribute that is used by the filter to accept/reject managed entities from contributing data to the sampler’s dataview. Managed entities whose specified attribute matches one of the listed values will be rejected by the filter. If the attribute is not specified on the managed entity or the specified attribute does not match one of the values provided it will be accepted by the filter.
samplers > sampler > plugin > Gateway-severityData > filter > filterAttributes Copied
A set of one or more filters which excludes managed entities if they contain attributes whose name and value match any of the filters defined here. If a managed entity is excluded all critical and warning labelled cell that are descendants of the managed entity will be excluded. Deprecated: See filterByAttribute setting.
samplers > sampler > plugin > Gateway-severityData > includeSeverityLevel Copied
Provides a drop-down list to select for only warning severities, critical severities, or both to appear in the dataview:
- Select
Criticalto have only critical severities appear in the dataview. Warning severities are excluded. - Select
Warningto have only warning severities included in the dataview. Critical severities are excluded. - Select
Warning and criticalto have both severity levels included in the dataview.
Mandatory: No
Default : Warning and critical is selected.
samplers > sampler > plugin > Gateway-severityData > includeUserAssigned Copied
Includes user assigned cells in the dataview.
Mandatory: No
Default: true
samplers > sampler > plugin > Gateway-severityData > includeSnoozed Copied
Includes snoozed cells in the dataview.
Mandatory: No
Default: false
samplers > sampler > plugin > Gateway-severityData > includeInactive Copied
Includes inactive cells in the dataview.
Mandatory: No
Default: false
samplers > sampler > plugin > Gateway-severityData > excludeSelfGenerated Copied
Whether to exclude rows that represent data generated by the plugin dataview itself.
As an example, a rule is placed on the timestamp column that causes cells to change to critical severity if the cell the row is monitoring has been at critical severity for more than 24 hours. If excludeSelfGenerated is set, then a new row will not be created if a cell in the timestamp column changes to critical severity after 1 day, because this is data generated by the plugin dataview itself.
Mandatory: No
Default: True
samplers > sampler > plugin > Gateway-severityData > maximumNumberOfRows Copied
Maximum number of rows that the dataview will display. If the number of Warning and Critical cells that should be displayed in the dataview is greater than the maximum number of rows, but the number of Critical cells is less than the maximum number of rows then only the critical cells will be displayed in the dataview. If the number of Critical cells that should be displayed in the dataview is greater than the maximum number of rows then no rows will be displayed in the dataview. Whenever cells are not displayed because displaying them would cause the maximum number of rows in the dataview to be breached, an error will be displayed in the sampling status.
The headline variables “warningItems” and “criticalItems” will always display the number of cells that match the filters provided by the sampler. They are not affected by this setting.
Mandatory: No
Default: 100
samplers > sampler > plugin > Gateway-severityData > attributeColumns Copied
A list of attributes that will be added to the dataview as additional columns. If a row represents a managed entity, the additional columns will be populated with the attribute values for the attributes defined. If a row represents the descendant of a managed entity, the additional columns will be populated with the attribute values of the ancestor managed entity for the attributes defined. If a row represents a gateway or a probe then the cells will be blank.
Snooze data Copied
samplers > sampler > plugin > Gateway-snoozeData Copied
The plugin monitors all data-items that are currently snoozed.
Headline legend Copied
The headline cells above the table display the following data:
| Column Name | Description |
|---|---|
| snoozedItemCount | Number of snoozed data-items on this gateway. |
| snoozedButAbsentItems | Number of data-items that are snoozed but not present on this gateway at this time. |
| filterIn | Displays the inclusive attribute filters. See filter setting. |
| filterOut | Displays the exclusive attribute filters. See filter setting. |
Table legend Copied
The table cells display the following data:
| Column Name | Description |
|---|---|
| cellId | Unique identifier for this cell. |
| componentType | The directory component type of this DataItem. One of gateway, probe, managedEntity, sampler, DataView, cell. |
| probe | The probe for this DataItem. |
| managedEntity | The managed entity for this DataItem. |
| sampler | The sampler for this DataItem. |
| dataView | The dataview for this DataItem. |
| cell | The cell for this DataItem. |
| type | The configured type for this DataItem. |
| plugin | The configured plugin type for this DataItem. |
| snoozeType | The type of snooze applied to the cell (Manual, SeverityTo, SeverityFrom, Time, DateTime, ValueChanges) |
| user | Name of the user that issued the snooze. |
| userFullName | Full name of the user that issued the snooze. |
| timestamp | Time the snooze was issued. |
| duration | Number of minutes that the snooze has been active.
|
| timeTillAutoSnooze | Number of seconds before the snooze is auto cancelled (if appropriate). |
| comment | User comment associated with this DataItem (if present). |
samplers > sampler > plugin > Gateway-snoozeData > filter Copied
This setting is used to filter the cells listed in the plugin. The cells are filtered by ManagedEntity. If the setting is not present then all snoozed cells on the gateway will be listed.
Mandatory: No
Default: No filtering
samplers > sampler > plugin > Gateway-snoozeData > filter > useAncestorManagedEntity Copied
If this setting is present then the sampler will only display snoozed items that are descendants of the managed entity to which the sampler belongs.
samplers > sampler > plugin > Gateway-snoozeData > filter > filterByAttribute Copied
A set of one or more filters which can be used to limit the number of managed entities that contribute data to the sampler’s dataview. Each filter is applied in order and a managed entity needs to be accepted by all the filters in order to contribute data.
samplers > sampler > plugin > Gateway-snoozeData > filter > filterByAttribute > include Copied
This setting defines a filter on an individual attribute. Any managed entities that have the specified attribute defined in the filter with a value that matches one of the values provided in the filter is accepted by this filter. Any other managed entity is rejected by this filter.
samplers > sampler > plugin > Gateway-snoozeData > filter > filterByAttribute > include > name Copied
Name of the managed entity attribute tested by this filter.
samplers > sampler > plugin > Gateway-snoozeData > filter > filterByAttribute > include > values Copied
Values of the managed entity attribute that is used by the filter to accept/reject managed entities from contributing data to the sampler’s dataview. Managed entities whose specified attribute matches one of the listed values will be accepted by the filter. If the attribute is not specified on the managed entity or the specified attribute does not match one of the values provided it will be rejected by the filter.
samplers > sampler > plugin > Gateway-snoozeData > filter > filterByAttribute > exclude Copied
This setting defines a filter on an individual attribute. Any managed entities that have the specified attribute defined in the filter with a value that matches one of the values provided in the filter is rejected by this filter. Any other managed entity is accepted by this filter.
samplers > sampler > plugin > Gateway-snoozeData > filter > filterByAttribute > exclude > name Copied
Name of the managed entity attribute tested by this filter.
samplers > sampler > plugin > Gateway-snoozeData > filter > filterByAttribute > exclude > values Copied
Values of the managed entity attribute that is used by the filter to accept/reject managed entities from contributing data to the sampler’s dataview. Managed entities whose specified attribute matches one of the listed values will be rejected by the filter. If the attribute is not specified on the managed entity or the specified attribute does not match one of the values provided it will be accepted by the filter.
samplers > sampler > plugin > Gateway-snoozeData > filter > filterAttributes Copied
A set of one or more filters which exclude managed entities if they contain attributes whose name and value match any of the filters defined here. If a managed entity is excluded all snoozed items that are descendants of the managed entity will also be excluded. Deprecated: See filterByAttribute setting.
samplers > sampler > plugin > Gateway-snoozeData > excludeSelfGenerated Copied
Whether to exclude rows that represent data generated by the plugin dataview itself.
For example, if excludeSelfGenerated is set and headline ‘managedEntity’ is snoozed, no rows will be generated.
Mandatory: No
Default: True
samplers > sampler > plugin > Gateway-snoozeData > attributeColumns Copied
A list of attributes that will be added to the dataview as additional columns. If a row represents a managed entity, the additional columns will be populated with the attribute values for the attributes defined. If a row represents the descendant of a managed entity, the additional columns will be populated with the attribute values of the ancestor managed entity for the attributes defined. If a row represents a gateway or a probe then the cells will be blank.
Mandatory: No
Menu Items Copied
Unsnooze Absent Items Copied
This command is available on the snoozedButAbsentItems headline if the Gateway-snoozeData plugin in enabled and on the gateway regardless.
This command requires confirmation from the user as on a busy gateway or gateway with many missing items it may be processor intensive. This may lead to the gateway becoming temporarily unresponsive.
There is also the risk of removing items that may return when connecting to probe or reconfiguring a sampler.
Gateway-SQL Copied
Introduction Copied
samplers > sampler > plugin > Gateway-sql Copied
This plugin is part of the Compute Engine functionality of the gateway; unlike the other Gateway plugins, it provides a way to summarise and reformat dataviews rather than to monitor the gateway. It uses an in-memory SQLite database to take data from multiple dataviews and combine them to provide a set of new dataviews. Note that the database is used within the plugin to manipulate the dataviews, not to store any historical data. The version of SQLite used in this plugin is sqlite-3.9.2 (See http://www.sqlite.org/releaselog/3_9_2.html).
A user can configure the plugin to take data from a pair of specified dataviews and combine them using a key column in each dataview.
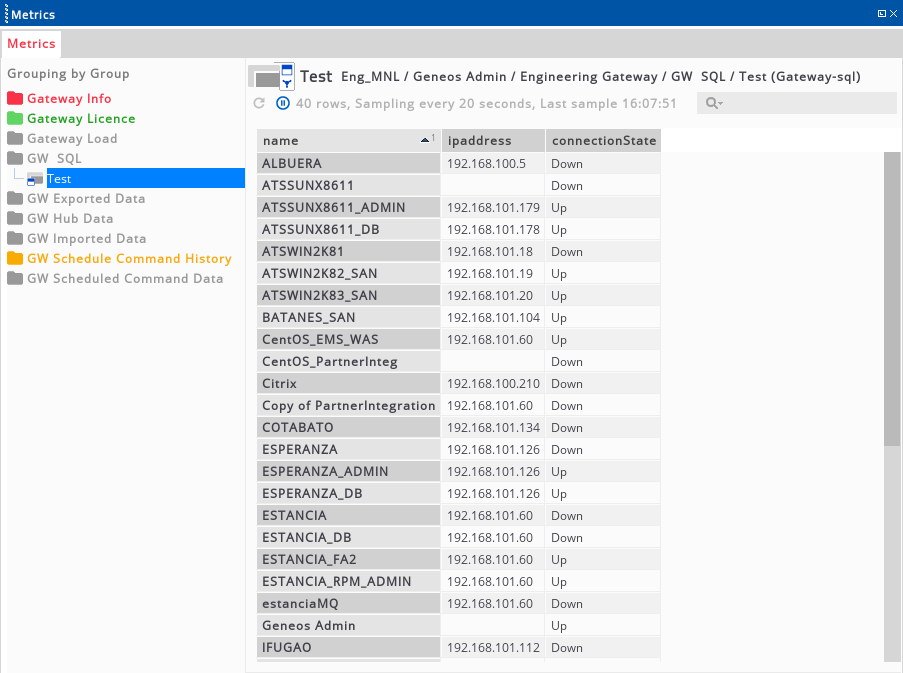
More complex SQL is available including OUTER JOINS, LEFT JOINS, GROUP BY. For a more in-depth list of queries that can be used, please look at http://www.sqlite.org/lang.html.
The sampler has a sample time. Every time that it samples, all the tables associated with the sources are wiped clean and the data is rescanned into the databases. The SQL is then run to extract the specified views and the Geneos data model is updated.
Note
The severity, snooze state and user assignment data reported in this dataview reflects the severity snooze state and user assignment of the data items, thus it is affected by severity, snooze state and snooze data imported from other gateways as well as severity snooze state and snooze data generated on this gateway.
Table Sources Copied
There are 3 different gateway sources that can be used to populate tables in the sampler database;
- A Dataview table (data from a single dataview)
- A Dataview’s headlines (data from a single dataview)
- A set of XPaths (data from multiple dataviews)
Dataview sources Copied
A single dataview can be used a source for a database table. If the columns are not specified in the setup, then the dataview columns will be the same as the columns in the source dataview. (This will include the rowname column). If the columns are specified in the setup, then just those columns present in the dataview that are specified in the setup will be copied into the sampler’s database. It is recomented that columns are specified where possible as this allows the table to be created before the dataview is populated. If the columns are not created and the source dataview is missing, the plugin will be unable to create a table and subsequent SQL queries will fail.
If the XPath provided matches multiple dataviews, then only the first dataview found will be used. The other dataviews will be ignored.
Below is the setup to obtain the dataview row data from a CPU dataview:
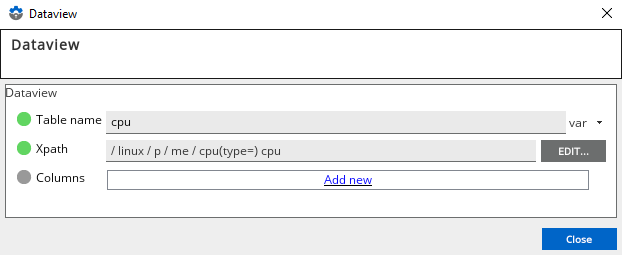
Setting Table Columns Copied
This section of the setup allows users to define the schema of the SQLite table created for each dataview. If this section is omitted, the table will have a column for each column in the dataview. If this section is present, any column whose name does not match a column in the dataview will be populated with NULL values and any columns present in the dataview but not specified will be omitted from the SQLite database table.
This section also allows the datatype of each column to be specified as TEXT, INTEGER or REAL. The default value if unspecified is TEXT. See http://www.sqlite.org/datatype3.html for more details about how types affect tables in SQLite.
Choosing whether or not to specify the columns for a dataview source involves a trade-off between efficiency and adaptability.
Explicitly specifying the columns has the advantages that:
- Columns that are not used in the queries need not be copied, saving memory and CPU resources in the Gateway.
- Queries will not fail if dataviews are missing as the tables will still exist in the database (though they will be empty).
On the other hand, with a fixed set of columns:
- The resultant query cannot adapt to new columns being added to the source dataview.
- The resultant dataview will not show an error if the source dataview is absent.
Below is the setup to obtain the dataview row data from a subset of the columns in a CPU dataview:
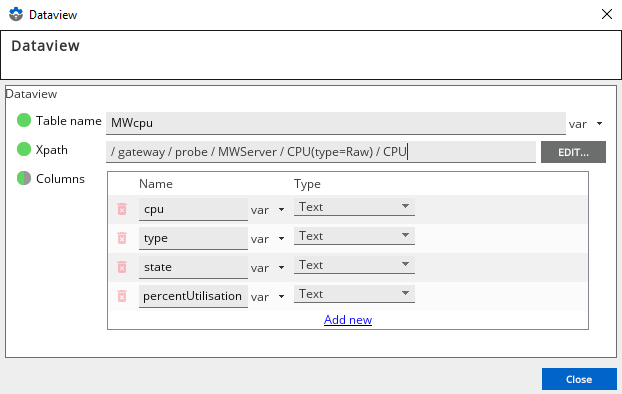
Headline sources Copied
The headlines from a single dataview can used a source for a database table. The table has a predefined structure: two columns of type TEXT, called “name” and “value”. There is a single row for each headline in the dataview. (‘samplingStatus’ is one of the dataview headlines and so will be one of the row names returned.)
If the XPath provided matches multiple dataviews, then only the first dataview found will be used. The other dataviews will be ignored.
Below is the setup to obtain the headlines from a CPU dataview:
XPath sources Copied
A set of XPaths can be used to define the source for a database table. These XPaths are separated into two groups: row XPaths and column XPaths.
The row XPaths define target items for the rows in the table. On each sample, the Gateway directory is searched for items that match the row XPaths and each item found is used to create a row in the database table. If an item matches more than one row XPath, it will only generate one row in the database table.
Each column in the database table is defined by a column XPath. This XPath selects a value for the column. Normally this is a relative XPath evaluated relative to the target item used to create the row.
This section also allows the datatype of each column to be specified as TEXT, INTEGER or REAL. The default value if unspecified is TEXT. See http://www.sqlite.org/datatype3.html for more details about how types affect tables in SQLite.
Below are two examples of XPath sources.
Example 1 Copied
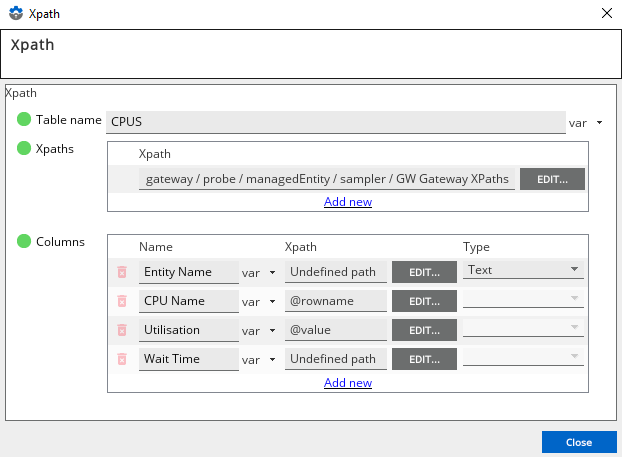
The Setup above selects all the rows from CPU dataviews in Managed Entities with an Attribute OWNER=ITRS. We are extracting the following information:
- Entity Name
- CPU Name
- Utilisation
- WaitTime
This is set up by targeting one cell from each row of the relevant dataviews. The XPath filters the dataviews using attribute name. The cell use here is the percentUtilisation column. (Note that you cannot use the cpu column as it is the rowname column and cannot be selected as a cell by the XPath). The XPath for each column is specified relative to the target cell.
- Entity Name: The Entity name is obtained from the entity that owns the target cell [ ancestor-or-self::managedEntity ]
- CPU Name: The CPU name is obtained from rowname of the target cell [ @rowname ]
- Utilisation: The utilisation is obtained from the value of the target cell [ @value ]
- WaitTime: The wait time is obtained from the percentWaitTime cell in the same row as the target cell [ ../cell[(@column=“percentWaitTime”)]/@value ]
The setup dialog above also shows how the data type can be set for each column if required (the default is TEXT).
Example 2 Copied
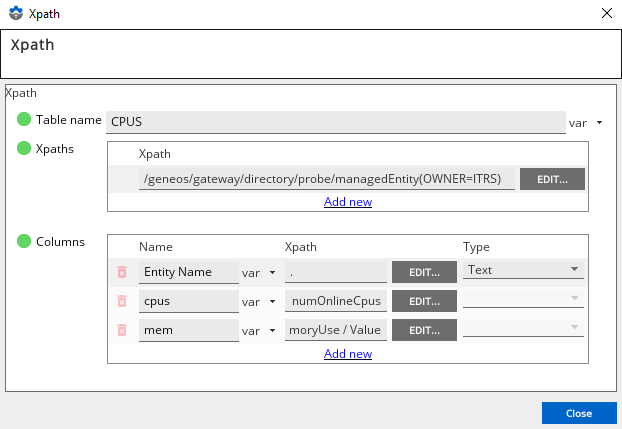
The Setup above selects a basic summary for each Managed Entity with an Attribute OWNER=ITRS. We are extracting the following information:
- Entity Name: The Entity name is obtained from the entity [ . ]
- cpus: The numOnlineCpus headline in the CPU sampler [ ./sampler[(@name=“CPU”)]/dataview[(@name=“CPU”)]/headlines/cell[(@name=“numOnlineCpus”)] ]
- mem: The memoryUse from the Hardware sampler [ ./sampler[(@name=“HW”)]/dataview[(@name=“HW”)]/rows/row[(@name=“memoryUse”)]/cell[(@column=“Value”)]]
These column XPaths utilise a short cut provided by gateway-sql. If a column XPath refers to a cell, then its value will be used as the column value. If the XPath refers to a data item that is not a cell (such as a directory, probe, managed entity or sampler), then the name of the data item will be used as the column value.
Sampler queries Copied
The examples above have shown the use of simple queries to populate the dataviews generated by the plugin.
Multiple views can be defined, each with its own query. Each view can combine tables from any combination of the data sources described in the previous section.
Queries are written in the dialect of SQL supported by SQLite, which is described at http://www.sqlite.org/lang.html.
The sampler performs SQL queries at three different times.
- Setup SQL: This query is performed every time the sampler is created. (e.g. at gateway startup and when the setup changes).
- Sampler SQL: This query is performed once per sample. It is performed after the tables have been populated
- View SQL: These queries (one for each view) are performed after the ‘Sampler SQL’ again once per sample.
Sampler processing Copied
The steps that the sampler goes through to generate its views are:
Sampler Setup Copied
This occurs when the sampler is first created. It also occurs when any sampler parameters are changed, as the sampler is destroyed and recreated at this time.
- Create a private in-memory database accessible only by this sampler
- Create the dataviews that will be populated by the sampler
- Run the setup SQL statements if defined
If there is an error on running the setup SQL then an error will be displayed in the sampling status on all the views and further changes will not occur to the views until the error is corrected.
Sampler Sample Copied
This occurs at a regular interval specified in the sampler setting.
- For each source table defined on the sampler
- Find the source dataview (does not apply to XPath sources)
- Drop the table from the database
- Recreate the table
- Populate the table from the source dataview (or row XPaths)
- Run the sampleSQL statements if defined
- For each output view defined on the sampler
- Empty the dataview
- Use the view’s SQL statement to extract data from the database
- Push the changes into the gateway
If an error occurs in stage 1 or stage 2 an error will be displayed in the sampling status on all the views. The processing will then stop for that sample. The next sample will start again and continue if the error no longer occurs.
If an error occurs in stage 3 then an error will be displayed in the sampling status of the view the error occurred upon. No further processing will occur on that view but the other views will still be processed.
When looking for a dataview in stage 1a, if the dataview is not found, or if the dataview is unpopulated (no row or column names defined) then an error will result. If multiple dataviews are found then the first one found will be used.
Variables in XPaths Copied
You can add variables to the XPaths used in the Gateway SQL sampler setup.

For example, if the XPath for a table is set to:
ancestor::managedEntity/sampler[(@name="Sampler")][(@type=var("typeName"))]/dataview[(@name="Dataview")]
The Gateway searches for the variable named typeName and inserts its value into the XPath according to variable scoping rules. It then evaluates the complete XPath to find matching directory components.
For more information, see Variable Scoping and Resolution.
Debugging Copied
The plugin provides debug settings to help to configure the sampler. These are set in the debug settings of the sampler. The following settings are available;
- statusDetails: This debug setting provides additional information to the log file if an error occurs during sampling.
- showQueries: This debug setting outputs all the SQL queries passed to the sampler’s database. This includes those defined in the configuration and those used by the sampler to create and populate source tables.
- debugSQLCommands: This debug setting enables a debug gateway command that allows the user to perform SQL commands on the in-memory database maintained by the sampler. Please note that this database is transitory and can be reset by setup changes/re-sampling.
- showSampleTimes: This debug setting will log time spent during each sample, which can be useful when profiling the setup. The times given mirror the times that are reported by the Gateway-load plugin when monitoring Gateway-sql.
In order to understand how much time is being spent processing these plugins, a new section has been added to the Gateway-gatewayLoad configuration to monitor the time spent in Gateway-sql plugins. This can be grouped and filtered by entity or sampler name, allowing a detailed breakdown by individual sampler.
Configuration Copied
samplers > sampler > plugin > gateway-sql > tables Copied
This section is used to specify the source data for a table in the sampler’s in-memory database.
samplers > sampler > plugin > gateway-sql > tables > dataview Copied
This allows the specification of a dataview table as the source of the data for the table. See Dataview sources
samplers > sampler > plugin > gateway-sql > tables > dataview > tableName Copied
The name of the table to create in the sampler’s in-memory database. This table is destroyed and recreated each sample.
samplers > sampler > plugin > gateway-sql > tables > dataview > xpath Copied
The path to a dataview used to populate a table in the sampler’s in-memory database. If this path points to more than one dataview then only the first matching dataview will be used. This path can be an absolute path or a relative path. If a relative path is used then the path will be relative to the instance of the sampler. So to get a specific dataview in the same managed entity you would use a path similar to the one below;
../sampler[@name="cpu"]/dataview[@name="cpu"]
samplers > sampler > plugin > gateway-sql > tables > dataview > columns Copied
The optional column names of the table.
If not specified then the table is destroyed and recreated each sample with columns that match the columns in the dataview.
If specified then the table is created at sampler start/setup change. The columns created are those specified in this section. If the optional affinities are set then those are used when creating the table. In the case when the columns are specified the table will be truncated rather than re-created each sample.
samplers > sampler > plugin > gateway-sql > tables > headlines Copied
This allows the specification of data from a dataview’s headline cells as the source of the data for an sql table. See Headline sources
samplers > sampler > plugin > gateway-sql > tables > headlines > tableName Copied
The name of the table to create in the sampler’s in-memory database. This table is destroyed and recreated each sample.
samplers > sampler > plugin > gateway-sql > tables > headlines > xpath Copied
The path to a dataview used to populate a table in the sampler’s in-memory database. If this path points to more than one dataview then only the first matching dataview will be used. This path can be an absolute path or a relative path. If a relative path is used then the path will be relative to the instance of the sampler. So to get a specific dataview in the same managed entity you would use a path similar to the one below;
../sampler[@name="cpu"]/dataview[@name="cpu"]
samplers > sampler > plugin > gateway-sql > tables > xpath Copied
This allows the specification of a subset of the geneos data as the source of the data for an sql table. See XPath sources for more details.
samplers > sampler > plugin > gateway-sql > tables > xpath > tableName Copied
The name of the table to create in the sampler’s in-memory database. This table is destroyed and recreated each sample.
samplers > sampler > plugin > gateway-sql > tables > xpath > xpaths Copied
A list of XPaths used to obtain a set of dataitems. Each dataitem will be used to generate a row in the table. The column XPaths (samplers > sampler > plugin > gateway-sql > tables > xpath > columns) will be used relative to these items to define the values to put in column of the row. See XPath sources for more details.
samplers > sampler > plugin > gateway-sql > tables > xpath > columns Copied
This specifies the columns of the table. The column definition is composed of:
- Name: This is the name of the column created in the database table
- XPath: This is path is used in conjunction with the table XPath to populate the table cells in the column. See XPath sources for more details.
- Type: This is the type of the database column. If not specified then it defaults to TEXT.
samplers > sampler > plugin > gateway-sql > views Copied
This section defines the views that will be created by the sampler. The sampler can create multiple views pulling data from the same set of dataviews.
samplers > sampler > plugin > gateway-sql > views > view > name Copied
This is the name of the dataview that is to be created.
samplers > sampler > plugin > gateway-sql > views > view > sql Copied
This is the sql query that will be run to produce the data for the dataview. The dataview is cleared each sample and then populated with the results from this query.
samplers > sampler > plugin > gateway-sql > views > view > showRowID Copied
This flag controls the way that view’s SQL query result is mapped into a Geneos dataview. If this flag is set then the row name will be column called RowID, that will contain an incrementing row number starting at 1. If the flag is missing or false then the row name will be the first column extracted from the database, as defined by the view’s SQL.
Mandatory: No
Default: false
samplers > sampler > plugin > gateway-sql > views > view > disabled Copied
This is the flag can be used to disable individual views in the sampler. If the flag is set the the views will not be generated, and the dataviews will not be added to the sampler.
Mandatory: No
Default: false
samplers > sampler > plugin > gateway-sql > views > view > Row limit Copied
Number of rows allowed in this view before truncation
Mandatory: No
Default: 200
samplers > sampler > plugin > gateway-sql > setupSql Copied
This defines a piece of SQL that is run when the in-memory database is created. This is run only once. (At gateway start up or when the sampler parameters are changed). This SQL can contain more than one statement (separated by semi-colons).
samplers > sampler > plugin > gateway-sql > sampleSql Copied
This defines a piece of SQL that is run after all the source tables have been populated, but before the view extraction queries are run. This SQL can contain more than one statement (separated by semi-colons) and is run on every sample of the sampler.
User assignment data Copied
samplers > sampler > plugin > Gateway-userAssignmentData Copied
The plugin monitors all data-items that are currently user assigned.
Headline legend Copied
The headline cells above the table display the following data:
| Name | Description |
|---|---|
| assignedItemCount | Number of data-items which have been assigned to users on this gateway. |
| assignedButAbsentItemsCount | Number of data-items which have been assigned to users but are not present on this gateway at this time. |
| filterIn | Displays the inclusive attribute filters. See filter setting. |
| filterOut |
Displays the exclusive attribute filters. See filter setting. Note: The `warningItems` and `criticalItems` values reported in this dataview reflects the severity of the Gateway, thus it is affected by severity and snooze data imported from other gateways as well as severity and snooze data generated on this gateway. |
Table legend Copied
The table cells display the following data:
| Column Name | Description |
|---|---|
| cellId | Unique identifier for this cell. |
| componentType | The directory component type of this DataItem. One of gateway, probe, managedEntity, sampler, DataView, cell. |
| probe | The probe for this DataItem. |
| managedEntity | The managed entity for this DataItem. |
| sampler | The sampler for this DataItem. |
| dataView | The dataview for this DataItem. |
| cell | The cell for this DataItem. |
| type | The configured type for this DataItem. |
| plugin | The configured plugin type for this DataItem. |
| assigner | The user that issued the assignment. |
| assignerFullName | Full name of the user that issued the assignment. |
| assignee | The user to which the DataItem is assigned. |
| assigneeFullName | Full name of the user to which the DataItem is assigned. |
| timestamp | Time the assignment was issued. |
| duration |
Number of minutes that the assignment has been active. Note: This view reports user assignment that was created by **the current Gateway** and does not reflect user assignment data from imported Gateways. Thus if a user assigns a cell using command delegation. The user assignment information will appear in the Gateway-userAssignmentData view on the exporting gateway, but not on the importing gateway. However if user assignment information is not imported but the data items are, then the item assigned will only be assigned on the importing gateway and the assignment information will appear in the Gateway-userAssignmentData view on the importing gateway. |
| comment | User comment associated with this DataItem (if present). |
samplers > sampler > plugin > Gateway-userAssignmentData > filter Copied
This setting is used to filter the cells listed in the plugin. The cells are filtered by ManagedEntity. If the setting is not present then all assigned cells on the gateway will be listed.
Mandatory: No
Default: No filtering
samplers > sampler > plugin > Gateway-userAssignmentData > filter > useAncestorManagedEntity Copied
If this setting is present then the sampler will only display assigned items that are descendants of the managed entity to which the sampler belongs.
samplers > sampler > plugin > Gateway-userAssignmentData > filter > filterByAttribute Copied
A set of one or more filters which can be used to limit the number of managed entities that contribute data to the sampler’s dataview. Each filter is applied in order and a managed entity needs to be accepted by all the filters in order to contribute data.
samplers > sampler > plugin > Gateway-userAssignmentData > filter > filterByAttribute > include Copied
This setting defines a filter on an individual attribute. Any managed entities that have the specified attribute defined in the filter with a value that matches one of the values provided in the filter is accepted by this filter. Any other managed entity is rejected by this filter.
samplers > sampler > plugin > Gateway-userAssignmentData > filter > filterByAttribute > include > name Copied
Name of the managed entity attribute tested by this filter.
samplers > sampler > plugin > Gateway-userAssignmentData > filter > filterByAttribute > include > values Copied
Values of the managed entity attribute that is used by the filter to accept/reject managed entities from contributing data to the sampler’s dataview. Managed entities whose specified attribute matches one of the listed values will be accepted by the filter. If the attribute is not specified on the managed entity or the specified attribute does not match one of the values provided it will be rejected by the filter.
samplers > sampler > plugin > Gateway-userAssignmentData > filter > filterByAttribute > exclude Copied
This setting defines a filter on an individual attribute. Any managed entities that have the specified attribute defined in the filter with a value that matches one of the values provided in the filter is rejected by this filter. Any other managed entity is accepted by this filter.
samplers > sampler > plugin > Gateway-userAssignmentData > filter > filterByAttribute > exclude > name Copied
Name of the managed entity attribute tested by this filter.
samplers > sampler > plugin > Gateway-userAssignmentData > filter > filterByAttribute > exclude > values Copied
Values of the managed entity attribute that is used by the filter to accept/reject managed entities from contributing data to the sampler’s dataview. Managed entities whose specified attribute matches one of the listed values will be rejected by the filter. If the attribute is not specified on the managed entity or the specified attribute does not match one of the values provided it will be accepted by the filter.
samplers > sampler > plugin > Gateway-userAssignmentData > filter > filterAttributes Copied
A set of one or more filters which exclude managed entities if they contain attributes whose name and value match any of the filters defined here. If a managed entity is excluded all assigned items that are descendants of the managed entity will also be excluded. Deprecated: See filterByAttribute setting.
samplers > sampler > plugin > Gateway-userAssignmentData > excludeSelfGenerated Copied
Whether to exclude rows that represent data generated by the plugin dataview itself.
For examples of this flag, see the entries in the Gateway-snoozeData or Gateway-severityData plugins.
Mandatory: No
Default: True
samplers > sampler > plugin > Gateway-userAssignmentData > attributeColumns Copied
A list of attributes that will be added to the dataview as additional columns. If a row represents a managed entity, the additional columns will be populated with the attribute values for the attributes defined. If a row represents the descendant of a managed entity, the additional columns will be populated with the attribute values of the ancestor managed entity for the attributes defined. It a row represents a gateway or a probe then the cells will be blank.
Mandatory: No
Menu Items Copied
Unassigned Absent Items Copied
This command is available on the assignedButAbsentItemsCount headline if the Gateway-userAssignmentData plugin in enabled and on the gateway regardless.
This command requires confirmation from the user as on a busy gateway or gateway with many missing items it may be processor intensive. This may lead to the gateway becoming temporarily unresponsive.
There is also the risk of removing items that may return when connecting to probe or reconfiguring a sampler.