Connect Geneos to ITRS Analytics
Overview Copied
ITRS Analytics is an observability platform for data storage and analytics. You can configure Gateways and Netprobes to publish data to ITRS Analytics so you can store and analyze metrics, logs and events in ITRS Analytics.
The Gateway connects to ITRS Analytics via two separate pipelines:
- Ingestion pipeline — the Gateway publishes monitoring data to ITRS Analytics. This is a write-only operation that uses gRPC over HTTP/2.
- Data pipeline — the Gateway retrieves historical data from ITRS Analytics to display in Active Console, and publishes commands to ITRS Analytics for execution via the Entity Viewer. This connection uses standard HTTPS REST APIs.
Prerequisites Copied
Before configuring Gateway to publish data to ITRS Analytics, ensure the following:
- Upgrade the Gateway to version 7.0.0 or later, as earlier versions are not supported for publishing to ITRS Analytics.
- Ensure the network infrastructure supports HTTP/2 and gRPC.
- Provide valid ITRS Analytics ingestion service credentials.
Communication protocol and requirements Copied
Gateway publishes data to ITRS Analytics using gRPC (Google Remote Procedure Call), which requires HTTP/2 as the underlying transport protocol.
Important
HTTP/1.x is not supported for Gateway to ITRS Analytics ingestion connection.
The technical decision to use gRPC and HTTP/2 provides several critical advantages for high-volume telemetry data:
- Multiplexing — HTTP/2 enables multiple concurrent streams over a single TCP connection, significantly reducing connection overhead when publishing metrics, events, and logs simultaneously.
- Binary protocol — gRPC uses Protocol Buffers (protobuf) for efficient binary serialization, reducing payload sizes and network bandwidth compared to text-based protocols.
- Bidirectional streaming — the full-duplex communication of HTTP/2 allows for efficient back-pressure mechanisms and flow control, essential for handling variable data volumes.
- Header compression — the HPACK compression of HTTP/2 reduces overhead from repeated headers, important when sending thousands of metrics per second.
- Performance at scale — for environments with hundreds of dataviews and high-frequency sampling intervals, gRPC with HTTP/2 provides superior throughput and lower latency compared to traditional REST APIs over HTTP/1.
Network infrastructure requirements Copied
Critical: Verify HTTP/2 and gRPC support for ingestion pipeline
The ingestion pipeline uses gRPC and requires network infrastructure that supports HTTP/2. All network infrastructure between Gateway and the ITRS Analytics ingestion endpoint must support HTTP/2 and gRPC. This includes:
- Load balancers
- Reverse proxies
- API gateways
- Web application firewalls (WAF)
- Ingress controllers (Kubernetes environments)
- Network proxies
The data pipeline can use normal proxies and does not require HTTP/2 or gRPC support. The data pipeline uses a different endpoint (for example,
test.itrslab.com) than the ingestion pipeline (for example,ingestion-test.itrslab.com).gRPC is not always enabled by default on many network devices and cloud services. Failure to verify this can result in connection failures or silent data loss.
Common infrastructure that requires explicit gRPC enablement Copied
The following infrastructure typically requires explicit configuration to support gRPC:
-
Cloud load balancers
- AWS Application Load Balancer (ALB) — supports gRPC starting from AWS ALB with HTTP/2 enabled. See Application Load Balancers now Support gRPC Workloads.
- AWS Network Load Balancer (NLB) — transparent to gRPC as it operates at Layer 4.
- Azure Application Gateway — Requires HTTP/2 configuration. See Azure Application Gateway configuration overview.
- Azure Load Balancer — transparent to gRPC as it operates at Layer 4.
- Google Cloud Load Balancing — supports gRPC natively. See gRPC load balancing on GCP.
-
Ingress Controllers (Kubernetes)
- NGINX Ingress Controller — requires gRPC annotations. See NGINX gRPC support.
- Traefik — supports gRPC with HTTP/2. See Traefik gRPC example.
- HAProxy Ingress — requires HTTP/2 backend configuration. See HAProxy HTTP/2 documentation.
- Istio — supports gRPC natively. See Istio traffic management.
-
Reverse Proxies
- NGINX — requires
grpc_passdirective. See NGINX gRPC proxying. - HAProxy — requires ALPN and HTTP/2 configuration. See HAProxy gRPC documentation.
- Apache HTTP Server — limited gRPC support; consider alternatives.
- Envoy Proxy — native gRPC support. See Envoy gRPC documentation.
- NGINX — requires
Legacy infrastructure compatibility
Old network devices, particularly those manufactured before 2015, may not support HTTP/2 or gRPC. This includes:
- Older hardware load balancers (F5 versions prior to v12.0, NetScaler versions prior to v11.0)
- Legacy firewalls without application-layer protocol support
- Outdated proxy servers
If your infrastructure includes such devices, they must be upgraded or bypassed for ITRS Analytics connectivity.
Connection test and validation Copied
Before deploying Gateway to ITRS Analytics publishing in production, verify that:
- Your network path supports HTTP/2 and gRPC.
- No intermediate proxies or firewalls are blocking or downgrading the connection.
- TLS/SSL certificates are properly configured for HTTP/2 negotiation.
ITRS Analytics concepts Copied
ITRS Analytics adopts a data model that includes many features that may sound familiar to Geneos users. However, it is important to recognise that these concepts are fundamentally different.
Entities Copied
Unlike the user-defined Managed Entities in Geneos, in ITRS Analytics an Entity is automatically created based on the dimensions that describe the data points. See the Data model for more information.
Entities can also have associated attributes but this does not affect the definition of an Entity. ITRS Analytics allows users to search for Entities metrics using both dimensions and attributes.
Geneos structures are mapped to ITRS Analytics entities, attributes, and metrics.
Consider an example:
| Item | Entity dimensions | Attributes | Metrics |
|---|---|---|---|
| Managed Entity | probe=itrspc101 | ConState=Up | |
| Managed Entity | probe=itrspc101 | HostName=itrspc101.itsgroup.com | |
| Managed Entity | COUNTRY=UK | ||
| Managed Entity | OS=Linux | ||
| Managed Entity | DEPT=SALES | ||
| Sampler | probe=itrspc101 | Plugin Name=CPU | |
| Sampler | managedEntity=pc101 | Group Name=Infra | |
| Sampler | sampler=CPU | ||
| Sampler | type=LinuxInfra | ||
| Dataview | probe=itrspc101 | numCpuCores | |
| Dataview | managedEntity=pc101 | numOnlineCpus | |
| Dataview | sampler=CPU | loadAverage1Min | |
| Dataview | type=LinuxInfra | loadAverage5Min | |
| Dataview | dataview=CPU | ||
| Row | probe=itrspc101 | type | |
| Row | managedEntity=pc101 | clockSpeed | |
| Row | sampler=CPU | percentUtilisation | |
| Row | type=LinuxInfra | percentUserTime | |
| Row | dataview=CPU | percentIdle | |
| Row | row=cpu_0 |
In general, traditional data generates the following entities:
- An entity to represent each Geneos Managed Entity.
- An entity to represent each Geneos sampler.
- An entity to represent each dataview (where headline metrics exist).
- An entity to represent each row in a dataview (or column if the dataview is pivoted).
Cells in dataview rows (and headlines) are mapped to metrics that exist on these ITRS Analytics entities according to the following rules:
- If the cell is marked as having a numeric data type in its schema then its contents will be published to ITRS Analytics as a
GAUGEmetric. - If the cell is marked as having a non-numeric data type in its schema then its contents will be published to ITRS Analytics as a
STATUS_METRIC. - If no schema has been defined, the Gateway will attempt to convert the cell to a
GAUGEmetric. If this succeeds the value will be published as aGAUGE, otherwise, it will be published as aSTATUS_METRIC.
For data that is sent to Geneos by a Collection Agent, the type of the metric will be preserved.
ITRS Analytics closely follows the data model used by the Collection Agent. For more information, see Data collection in an orchestrated environment.
Data throttling Copied
To reduce data processed by ITRS Analytics, without compromising monitoring or investigation, the Gateway throttles publishing of fast-updating dataview cells that are not actively monitored. Cells are considered to be actively monitored if they have a severity of OK, Warning, or Critical.
Cells that are not actively monitored will be published at most once every 20 seconds by default. This rate can be adjusted in Advanced publishing settings > Throttle.
The throttling only applies to dataviews from samplers with a sample interval shorter than the Throttle setting. Dataviews in dynamically created samplers and API samplers (which have no sample interval) are not affected by throttling.
Example 1: Throttling applied
- Sample interval: 1 second
- Throttle setting: 20 seconds
Cells without severity are published once every 20 seconds. Cells with severity (OK, Warning, Critical) continue publishing every second.
Example 2: Throttling not applied
- Sample interval: 20 seconds
- Throttle setting: 10 seconds
No throttling is applied because the sample interval is already longer than the throttle setting. All updates are published as they occur.
Data labels Copied
Gateway sends two types of labels that allow you to search through ITRS Analytics entities:
- Dimensions: these are the name-value pairs used to uniquely identify an ITRS Analytics Entity.
- Attributes: these are observed pieces of information about an ITRS Analytics entity, such as the
osTypeof a Geneos Managed Entity.
Every metric has a set of dimensions that uniquely identify it. These are derived from the Geneos hierarchy of gateway, managedEntity, sampler, type, dataview, and row.
Geneos Managed Entity attributes set in the Gateway Setup Editor are sent as ENTITY_ATTRIBUTE metrics on the corresponding ITRS Analytics entities in the itrsgroup.com/geneos/gse namespace. Gateway also sends each sampler’s Group and PluginName as ENTITY_ATTRIBUTE metrics on the ITRS Analytics entity representing that sampler.
Netprobe parameters, such as HostName, Port, ConState, OS, or Version, are sent as ENTITY_ATTRIBUTE metrics on each ITRS Analytics entity representing a Geneos Managed Entity running on that Netprobe. The Netprobe also sends a sanitized version of OS called osType.
Signals Copied
Gateway sends severity changes to ITRS Analytics as signals, and a signal stream is provided for every metric. Gateway sends the severity and the value on the cell at the time that the severity changed, and snooze events to ITRS Analytics.
Audit Copied
Gateway sends audit events to ITRS Analytics when a connection is established. Audit events originating from a Gateway will have a dimension of gateway. Audit events originating from a Netprobe (like running a command on a Netprobe) will have dimensions of both gateway and probe.
The Gateway will publish the following audit events to ITRS Analytics:
- User logon and logoff events
- Setup changes
- Triggering of commands
- Delegating of commands to other Gateways
- Triggering of REST endpoints
- Triggering of actions
- Triggering of alerts
ITRS Analytics connection configuration Copied
Understand publication limitations before connecting
Before enabling ITRS Analytics publishing, review the Controlling publishing and Best practices for ITRS Analytics publishing sections. Understanding publication limitations, filtering strategies, and best practices upfront will help you avoid publishing unnecessary or unsuitable data and ensure optimal performance and cost management.
Data from the Gateway is published to ITRS Analytics via the ingestion service. This service is installed as part of your ITRS Analytics installation.
By default, Gateway will publish all metrics, severity events, and audit events to ITRS Analytics. You can configure filtering strategies to control what data is published and minimize downstream data processing requirements in ITRS Analytics. To configure include and exclude filters, see Strategies and Dataview-level publishing.
The ITRS Analytics connection section of the Gateway Setup Editor provides the following options:
| Setting | Description | Default |
|---|---|---|
| Enabled | Enables or disables publishing to ITRS Analytics. | Enabled |
| Mode | Specify the publishing mode, choose from:
|
connection |
Statistics only mode Copied
Enable the statisticsOnly mode before publishing to ITRS Analytics. Running this mode is valuable for understanding data volume, throughput rates, and network bandwidth requirements before enabling actual publishing. This helps you determine the required ITRS Analytics cluster size.

Statistics are recorded to the self-monitoring dataviews and to the Gateway log file. Logs are generated every 10 minutes and include audit events, entity attributes, events, metrics, and the total number of messages sent and dropped.
Example Copied
Given the following Gateway log example:

- Data from the Gateway log: 22,486 total messages sent over the past 10 minutes
- Message rate: total messages sent ÷ 600 seconds (10 minutes) = 37.5 messages per second
Use the ITRS Analytics sizer tool to determine the cluster size that can accommodate the calculated message rate. In this case, the smallest cluster size, Micro, meets the requirement as it can handle up to 3,000 messages compared to the calculated rate of 37.5 messages per second.
Tip
After determining your ITRS Analytics cluster size, you can continue using the ITRS Analytics sizer tool to enter your configuration details, cluster type, and the ITRS Analytics apps you intend to install. Afterwards, click Calculate to determine the minimum requirements needed to set up your ITRS Analytics cluster.
Test small-scale Gateway publishing Copied
Important
Before enabling ITRS Analytics publishing across your entire environment, test publishing using a small number of Gateways first.
-
Start with a single Gateway — enable
statisticsOnlymode on a single Gateway for a few days to establish a baseline and identify any issues. -
Monitor vital statistics — review the self-monitoring dataviews regularly to check for early warning signs:
connectionStatus— check forTransient FailureorShutdownstatus, indicating connection or ingestion issues.messagesDroppedPerSample— increasing values indicate data loss or buffer issues.metricsDropped— metrics dropped due to type mismatches between Geneos cells and schema definitions.metricsChanged— schemaless metrics changing type, which can indicate data quality issues.dataviewsWithErrors— dataviews experiencing publication errors.messageRateandbyteRate— verify these align with your expected data volume and ITRS Analytics cluster sizing.
-
Gradually scale — only after validating that the initial Gateway is publishing successfully with no red flags should you enable publishing on additional Gateways, scaling gradually while continuing to monitor the vital statistics.
This phased approach helps prevent overwhelming the ITRS Analytics system with unexpected data volumes and allows you to identify and resolve publication issues before they affect your entire environment.
Connection mode Copied
The ITRS Analytics connection configuration is divided into two distinct functions:
-
Publishing — The Gateway acts as a data producer, sending metrics, events, and logs to ITRS Analytics via the ingestion service. This is a write-only operation using gRPC over HTTP/2.
-
Data access — The Gateway uses this connection to retrieve historical data from ITRS Analytics to serve to connected Active Consoles for charting and analysis, and to publish commands to ITRS Analytics for execution via the Entity Viewer. This connection uses HTTPS REST APIs. For more information, see publish and execute Gateway commands in ITRS Analytics.
These are independent configurations because:
- Different credentials may be required (ingestion service account vs data access user account) as different Gateways may publish data to ITRS Analytics, while only specific Gateways may need to read data from ITRS Analytics. This follows the principle of least privilege.
- Different network paths may be used (direct ingestion vs web console access).
- Different proxy configurations may apply.
- Publishing can be enabled without data access (one-way data flow).
Basic configuration - Publishing Copied
To start the connection between Gateway and ITRS Analytics, you must configure the Publishing settings in the ITRS Analytics connection section in the Gateway Setup Editor.

| Section | Setting | Description |
|---|---|---|
| Connection | Verify server certificate | Enables or disables the server certificate verification. This setting applies to both the connection used to publish data to ITRS Analytics and the connection used to access data from ITRS Analytics. If this parameter is set to Default: True |
| Connection | Root certificates | Specify one or more root CA certificates used to sign the certificates for both ingestion service and data access. A root certificate is required for self-signed certificates or certificates from internal/private CAs not in the system trust store. It is not required for public CA certificates (e.g., Let’s Encrypt, DigiCert) already trusted by the operating system. Provide one or more of the following:
|
| Connection > Publishing | Service address | Specify the ITRS Analytics ingestion service hostname with the When you install ITRS Analytics, it will ask you for the ingestion endpoint where the Gateway will publish data. This can also be copied from the Certificate tab of the ITRS Analytics Admin page. |
| Connection > Publishing | Credentials | Specify the ITRS Analytics user credentials to access the ITRS Analytics ingestion service. These username and password credentials function like an API key rather than traditional user login credentials. They are used for service-to-service authentication and are not intended for interactive user login. These credentials will allow the Gateway to connect to ITRS Analytics to publish data. You must create an ingestion user using the ITRS Analytics IAM app. In your ITRS Analytics web console, click Admin from the left-hand menu and go to the IAM tab. Select the Users menu to add a new user or use an existing one. |
| Connection > Publishing | Proxy | Specify the Publishing proxy settings, allowing you to configure proxy connections at the Gateway level. |
Basic configuration - Data access Copied
If the Gateways connected to your Active Console publish data to ITRS Analytics, then those Gateways will share the ITRS Analytics connection details with the Active Console so you can create history charts by querying data in ITRS Analytics.
To allow a connected Active Console to access ITRS Analytics data, ensure that the default data source in your Active Console is set to ITRS Analytics. This can be viewed under Tools > Settings > General > Default data source.

You must also configure the Data access section in the ITRS Analytics connection setting in the Gateway Setup Editor.

You can define one or more ITRS Analytics data access services (each with its own name, address, credentials, realm, and proxy). The Gateway publishes commands to every configured ITRS Analytics data access service. For other data access features, such as querying historical data, the Gateway uses only the first configured service.
Under Connection > Data access > Services, add one entry per ITRS Analytics data access service. Each entry uses these settings:
| Setting | Description |
|---|---|
| Name | Display name for the service in Gateway self-monitoring. If you leave this blank, the Data Access self-monitoring dataview shows the service address in the Name column. |
| Address | Specify the ITRS Analytics Web Console host name or base URL. The Gateway uses this address to access the ITRS Analytics REST API. This is typically the main web console URL for your ITRS Analytics instance. For example: |
| Credentials > usernameAndPassword > Username | Specify the ITRS Analytics user name to access data from ITRS Analytics. Using the ITRS Analytics IAM app, you must:
|
| Credentials > usernameAndPassword > Password | Specify the password for the user account you configured in Username. |
| Credentials > usernameAndPassword > Realm | Specify the realm name for connecting to ITRS Analytics. The default realm is obcerv. Keep this value unless your organization uses a custom realm.
|
| Credentials > apiToken > Token | Specify the API token for ITRS Analytics data access. |
| Credentials > apiToken > Realm | Specify the realm name for connecting to ITRS Analytics. The default realm is obcerv. |
| Proxy | Specify the Data access proxy settings for Gateway-level proxy connections. |
Configuring the data access section also allows you to publish Gateway commands to ITRS Analytics and execute them directly from the ITRS Analytics Web Console. For more information, see Configure Geneos commands for ITRS Analytics.
The following settings for a single data access server are deprecated but are still supported. These provide the same functionality as the settings found under the Services section above.
| Section | Setting |
|---|---|
| Connection > Data access | Service address |
| Connection > Data access | Credentials |
| Connection > Data access | Realm |
| Connection > Data access | Proxy |
Self-monitoring Copied
Gateway self-monitoring is enabled by default, displaying the current state of ITRS Analytics publishing if the ITRS Analytics connection has been configured. Self-monitoring statistics are reported in two dataviews under Gateway Info > ITRS Analytics.
Detail dataview Copied

| Name | Description |
|---|---|
| name | Name of the data type. |
| sendState | Either SENDING or BUFFERING. |
| deliveryStatus | Delivery status of the last message. This can be either NONE, SUCCEEDED, RETRYING, or FAILED. |
| byteRate | Transfer rate in bytes per second. |
| messagingRate | Total transfer rate in messages per second across all three queues. |
| maxBufferSize | Maximum number of buffered messages. |
| messagesInBuffer | Current number of messages in the buffer. |
| messagesDroppedPerSample | Number of messages dropped in the last sampler. |
Summary dataview Copied

| Name | Description |
|---|---|
| byteRate | Transfer rate in bytes per second. |
| connectionStatus | Shows the connection status. This can be either Statistics only, Idle, Ready, Connecting, Transient Failure, or Shutdown. |
| dataviewsPublished | Number of dataviews published. |
| dataviewsUnpublished | Number of dataviews unpublished. |
| dataviewsWithErrors | Number of dataview with errors. |
| enabled | The ITRS Analytics connection can be either Enabled or Disabled. |
| ingestionEndpoint | ITRS Analytics publishing endpoint. |
| messageRate | Transfer rate per queue in messages per second. |
| messagesDroppedPerSample | Average number of messages dropped per sampler. |
| metricsChanged | Number of schemaless metrics initially published as one type (String, Number, or DateTime), which subsequently changed to a different type. |
| metricsDropped | Number of metrics dropped due to type mismatches between data in the Geneos cells and their schema definition of data to publish. |
Data Access dataview Copied

| Column Name | Description |
|---|---|
| name | Configured service display name or the dataEndpoint value when no name is set. |
| dataEndpoint | ITRS Analytics data access endpoint. |
| accessTokenUser | Shows the ITRS Analytics user name used for data access when the service credentials is Username and password. Otherwise, this cell is empty. |
| accessTokenAvailable | Indicates whether an access token is available. Active Console requires this token to access historical data from ITRS Analytics. |
| apiTokenExpiry | Shows the expiration time of the configured API token when the service credentials is Api token. Otherwise, this cell is empty. |
| subscribedToCommands | Indicates whether the Gateway is subscribed to command execution for that service. |
Additional ITRS Analytics connection configuration Copied
Proxy configuration Copied
ITRS Analytics connection settings support proxy configuration at both Gateway and Netprobe levels. This hierarchical configuration system allows for:
- Centralized defaults, as common settings are configured once at the Gateway level.
- Flexible overrides, as individual probes or groups of probes can be customized as needed.
- Network segmentation, as different probes can use different proxies or direct connections.
- Security flexibility, as probes in different environments can use different credentials.
Gateway-level proxy settings are configured in the ITRS Analytics Connection section of the GSE. These settings are automatically inherited by all Netprobes connected to the Gateway, unless specifically overridden at the individual probe or probe group level.

There are two types of proxy configurations available:
-
Publishing proxy — for data publishing to ITRS Analytics.
Setting Description Host Hostname or IP address of the proxy server. Port Port number of the proxy server. Authentication Optional proxy authentication. This can be set to None, or you can specify ausernameandpassword. -
Data access proxy — for accessing ITRS Analytics data.
Setting Description Host Hostname or IP address of the proxy server. Port Port number of the proxy server. Type Proxy protocol type. Select from: - HTTP — standard HTTP proxy
- HTTPS — secure HTTP proxy
- HTTP 1.0 — HTTP proxy using version 1.0 protocol
- SOCKS 4 — SOCKS version 4 proxy
- SOCKS 5 — SOCKS version 5 proxy
- SOCKS 4A — SOCKS version 4A proxy
- SOCKS 5 Hostname — SOCKS version 5 with hostname resolution
Authentication Optional proxy authentication. This can be set to None, or you can specify ausernameandpassword.
Probe-level configuration overrides Copied
ITRS Analytics connection settings configured at the Gateway level are automatically propagated to all connected Netprobes and Self-Announcing Netprobes (SAN probes). However, these settings can also be overridden at the probe and probe group level as needed.
Probe-specific ITRS Analytics connection settings can be configured in the Probe > ITRS Analytics Connection section of the GSE. Enable Override IAX Connection and the specific connection settings you want to configure at the probe level.

Note
If you do not need to override the Gateway settings, no configuration is needed in this section of the GSE.
| Setting | Description |
|---|---|
| Mode > None | Disable ITRS Analytics connection for the probe. |
| Mode > Statistics only | Enable statistics logging for the probe while maintaining publishing at the Gateway level. |
| Mode > Connection > Service address | Override the ITRS Analytics ingestion service endpoint for the specific probe. |
| Mode > Connection > Credentials | Override the Gateway credentials with probe-specific credentials.
|
| Mode > Connection > Proxy | Override the Gateway proxy settings with probe-specific proxy settings.
|
| Mode > Connection > TLS | Override the Gateway TLS settings with probe-specific TLS settings.
|
Self-Announcing Netprobes (SAN probes) configuration Copied
Self-Announcing Netprobes (SAN probes) are Netprobes that can be deployed on any host without prior Gateway configuration. SAN probes have enhanced ITRS Analytics connection configuration capabilities:
- Inheritance of the ITRS Analytics configuration from the Gateway — SAN probes automatically receive the ITRS Analytics connection configuration from the Gateway, including proxy settings and credentials.
- Netprobe setup file configuration — SAN probes can read ITRS Analytics connection settings from their Netprobe setup file, allowing for probe-specific configuration that overrides Gateway defaults.
- Advanced settings propagation — advanced ITRS Analytics publishing settings configured at the Gateway-level are automatically propagated to SAN probes.
You can configure ITRS Analytics Connection settings once at the Gateway level, and they will automatically apply to all SAN probes in your environment. This ensures that SAN probes can fully participate in ITRS Analytics data publishing while maintaining the flexibility to use probe-specific configuration when needed.
Configuration examples Copied
The following examples demonstrate common ITRS Analytics connection configuration scenarios. You can also refer to these examples when configuring the setup file of a SAN probe to override specific settings.
Gateway with publishing proxy (authentication):
<iaxIngestionConnectionInfo>
  <serviceAddress>https://ingestion.example.com</serviceAddress>
  <credentials>
    <username>ingestion-api</username>
    <password>your-password</password>
  </credentials>
  <proxy>
    <proxyServer>
      <host>proxy.company.com</host>
      <port>8080</port>
      <authentication>
        <password>
          <username>proxy-user</username>
          <password>proxy-password</password>
        </password>
      </authentication>
    </proxyServer>
  </proxy>
</iaxIngestionConnectionInfo>
Data access with SOCKS proxy (with type selection and authentication):
<dataAccess>
  <services>
    <service>
      <name>Analytics Example</name>
      <address>https://analytics.example.com</address>
      <credentials>
        <usernameAndPassword>
          <username>data-access-user</username>
          <password>
            <stdAES>encrypted-data-access-password</stdAES>
          </password>
        </usernameAndPassword>
      </credentials>
      <proxy>
        <host>socks-proxy.company.com</host>
        <port>1080</port>
        <type>
          <socks_5/>
        </type>
        <authentication>
          <password>
            <username>proxy-user</username>
            <password>
              <stdAES>encrypted-proxy-password</stdAES>
            </password>
          </password>
        </authentication>
      </proxy>
    </service>
  </services>
</dataAccess>
Probe overriding Gateway credentials and proxy:
<probe name="special-probe">
  <iaxIngestionConnectionInfo>
    <credentials>
      <override>
        <username>probe-specific-user</username>
        <password>probe-specific-password</password>
      </override>
    </credentials>
    <proxy>
      <override>
        <host>different-proxy.company.com</host>
        <port>3128</port>
        <authentication>
          <none/>
        </authentication>
      </override>
    </proxy>
  </iaxIngestionConnectionInfo>
</probe>
Probe disabling inherited proxy:
<probe name="direct-connection-probe">
  <iaxIngestionConnectionInfo>
    <proxy>
      <none/>
    </proxy>
  </iaxIngestionConnectionInfo>
</probe>
Probe overriding advanced settings (block override):
<probe name="custom-advanced-probe">
  <iaxIngestionConnectionInfo>
    <advancedPublishingSettings>
      <override>
        <rpcTimeout>10000</rpcTimeout>
        <throttle>30</throttle>
        <batchSize>1000</batchSize>
        <batchTimeout>1000</batchTimeout>
        <queueSize>100000</queueSize>
        <auditQueueSize>5000</auditQueueSize>
        <statisticLogging>
          <filename>probe-specific-stats.log</filename>
          <maxSize>2048</maxSize>
          <interval>300</interval>
        </statisticLogging>
      </override>
    </advancedPublishingSettings>
  </iaxIngestionConnectionInfo>
</probe>
Advanced configuration Copied
The Advanced publishing settings allow you to fine-tune the Gateway’s publishing behavior for optimal performance and reliability. These settings control batching, queuing, timeouts, and diagnostic logging.
Note
Most users should start with default values. Only adjust these settings after understanding your specific requirements through monitoring the self-monitoring dataviews and analyzing publishing statistics.
Below are some possible situations when to adjust advanced settings:
- High-volume environments — environments with thousands of dataviews or sub-second sampling intervals.
- Network constraints — high-latency networks or bandwidth-limited connections.
- Reliability requirements — situations requiring guaranteed delivery or specific back-pressure handling.
- Troubleshooting — diagnosing publishing issues or capacity planning.

| Settings | Description |
|---|---|
| RPC timeout | The time the Gateway waits for a gRPC response from the ITRS Analytics ingestion service before considering the request failed. Each batch of metrics sent to ITRS Analytics is a gRPC call. If the ingestion service does not respond within this timeout, the Gateway considers the call failed. The request is then retried according to gRPC retry policies. Default: Unit: milliseconds Mandatory: No |
| Throttle | Controls the publishing rate of dataview cells that are not actively monitored, such as cells without severity OK, Warning, or Critical. These cells are published at most once every See Data throttling for more information. Default: Unit: seconds Mandatory: No |
| Concurrent requests | Controls the number of concurrent requests that the Gateway will send to ITRS Analytics. The Gateway uses a single gRPC connection with multiple services in a single channel, increasing throughput by sending multiple messages simultaneously. Default: Mandatory: No |
| Batch size | The maximum number of datapoints accumulated before a batch is sent to ITRS Analytics. Once the batch reaches this size, it is immediately transmitted via gRPC. Datapoints accumulate in memory until the batch reaches Default: Unit: datapoints Mandatory: No |
| Batch timeout | The maximum time the Gateway waits before sending a partially filled batch to ITRS Analytics. This ensures datapoints are not delayed indefinitely if the Default: Unit: milliseconds Mandatory: No |
| Queue size | The maximum number of messages (batches) the Gateway can hold before it starts dropping messages. This queue acts as a buffer between data generation and network transmission. If the queue fills, the oldest messages are dropped. The Gateway logs dropped messages and increments the Default: Mandatory: No |
| Audit queue size | The maximum number of audit event messages the Gateway can buffer before dropping them. Unlike the main queue (in-memory), audit messages are saved to disk for durability. Audit events represent critical security and compliance data such as user logon/logoff events, configuration changes, command executions, and action and alert triggers. These events have a lower volume than metrics and require persistence across Gateway restarts or crashes. Default: Mandatory: No |
| Statistic Logging > Filename | The filename to which the ITRS Analytics publishing statistics are written. The maximum size of this file is defined in Statistic Logging > Max size. If this value is empty, the statistics are written to the component log file. Default: `` Mandatory: No |
| Statistic Logging > Max size | The maximum size (in Kbs) of an ITRS Analytics publishing statistics file. If the file exceeds this size, it is moved to a Default: Mandatory: No |
| Statistic Logging > Interval | The rate in seconds in which ITRS Analytics publishing statistics are generated. Default: Unit: seconds Mandatory: No |
Probe-level advanced publishing settings overrides Copied
Advanced ITRS Analytics publishing settings configured at the Gateway level are automatically propagated to all connected Netprobes and Self-Announcing Netprobes (SAN probes). This ensures consistent configuration across the entire monitoring infrastructure while still allowing probe-specific overrides when needed.
If you need to override the inherited advanced ITRS Analytics publishing settings, enable Override IAX Connection and Advanced publishing settings from the probe configuration.

Note
If you do not need to override the Gateway settings, no configuration is needed in this section of the GSE.
Individual probes can override the advanced publishing settings configured on the Gateway as a block override. Individual advanced settings cannot be selectively overridden. You need to configure all of the following settings:
- RPC Timeout
- Batch size
- Batch timeout
- Queue size
- Statistic Logging
- Filename
- Max size
- Interval
Important
When overriding advanced publishing settings at the probe level, you must specify all advanced configuration values required. Any advanced settings not explicitly configured in the probe override will use their default values, not the configured values from the Gateway.
Controlling publishing Copied
By default, when ITRS Analytics publishing is enabled, all dataviews from all managed entities are published. However, you can control publishing at a granular level using several mechanisms.
Note
Not all Geneos dataviews are suitable for ingestion and analysis in ITRS Analytics. For example:
- The Top plugin uses a positional index as its primary key, so row identities change as processes start, stop, or reorder. This means historical samples cannot be reliably correlated to the same underlying process or entity, which prevents ITRS Analytics from building meaningful time series.
- The Processes plugin configured with a catch‑all regex such as
.*will enumerate every process on the host, producing short‑lived rows whose keys and column set change frequently. This results in large, unstable data volumes not suited for efficient storage, aggregation, and analysis in ITRS Analytics.
Strategies Copied
The primary mechanism for controlling what data is published is through setting up strategies. Strategies allow you to:
- Include specific dataviews — publish only specific samplers, managed entities, or dataviews using XPath targets.
- Exclude specific dataviews — prevent specific data from being published while publishing everything else.
- Combine filters — use multiple strategies together for fine-grained control.
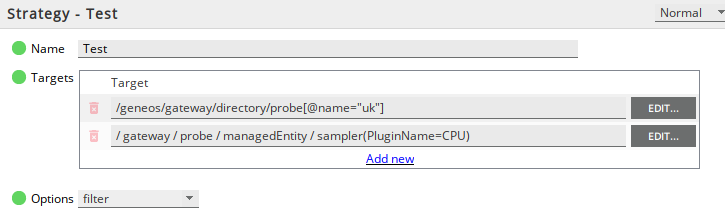
| Setting | Description | Default |
|---|---|---|
| Name | Specifies a name to uniquely identify the strategy. | New Strategy |
| targets | One or more XPaths identifying the data items to which the strategy applies. These XPaths must point to one or more Netprobes, Managed Entities, samplers, or dataviews. XPaths that reference run-time values such as severity or connection state, or XPaths that point to individual cells are not supported. | |
| Options | Specifies what type of strategy to use. The following options are available:
|
filter |
Note
If you specify both include filters and exclude filters, a data item is published if it is selected (directly or as an ancestor or descendant) by at least one include target and it is not selected (directly or as a descendant) by any exclude target.
Strategy Group Copied
Strategies may be grouped for organisational purposes. This has no effect on their application but is useful for grouping categories and making them easier to find in the navigation tree.
You must specify a name when creating a strategy group.
Dataview-level publishing Copied
You can control publishing to ITRS Analytics at the dataview level by enabling publishing for each dataview that you want to publish. This is useful if you want to publish only specific dataviews with relevant data, rather than publishing everything.
Dataview schemas are defined under the Publishing tab of a sampler configuration in the Gateway Setup Editor.
-
Ensure you have configured the ITRS Analytics connection in your Gateway.
-
Navigate to the Publishing tab in your sampler configuration in the Gateway Setup Editor.
-
Click Add new in the Schemas > Dataviews section.
-
Specify the name of the dataview that you want to publish to ITRS Analytics.
-
Select the data schema type.
- If specifying a data schema, click the Data menu and ensure that the Publish option is checked.
- If specifying a sampler schema static variable, ensure that the Publish option is checked in the sampler schema static variable configuration.

FKM-specific publishing Copied
The File Keyword Monitor (FKM) plugin does not publish the data row that contains the trigger information to ITRS Analytics.
The log data collected by the FKM plugin can be published directly to ITRS Analytics from the Netprobe. The data does not go via the Gateway. Publishing to ITRS Analytics can be controlled at the file level:
-
Configure the ITRS Analytics connection in your Gateway. The Netprobe uses the same connection parameters as the Gateway, unless overridden in the ITRS Analytics Connection section of the Probe or Probe group settings in the Gateway Setup Editor.
-
Enable publishing for each monitored FKM file in the Gateway Setup Editor as shown in the images below. See FKM ITRS Analytics publishing for more information.
-
When ITRS Analytics publishing is enabled:

-
When ITRS Analytics publishing is disabled:

-
ITRS Analytics data governance and filters Copied
In addition to Gateway-side filtering strategies, ITRS Analytics provides its own data governance features.
The following features are available in the ITRS Analytics Ingestion app:
- Geneos filters — apply filters in ITRS Analytics to manage data points from Geneos after ingestion.
- Data retention policies — control how long different types of data are stored.
- Eviction rules — define when inactive entities and their data will be removed.
Consider using a combination of Gateway-side and ITRS Analytics-side controls for comprehensive data management.
Best practices for ITRS Analytics publishing Copied
- Start with exclude-by-default. Use include filters to publish only what you need, rather than excluding what you do not need.
- Monitor self-monitoring dataviews. Watch
metricsDroppedandmetricsChangedto identify data quality issues. - Test with
statisticsOnlymode to understand your data volume before enabling publishing. - Define schemas for custom dataviews to avoid type detection issues.
- Use Collection Agent for new integrations. Collection Agent provides explicit, well-defined data models optimized for ITRS Analytics.
- Review toolkit dataviews as many toolkit plugins were designed for real-time Active Console viewing, not long-term analytics storage.
- Consider data lifecycle as not all data needs the same retention period. Use ITRS Analytics data retention policies to age out high-volume, short-lived data.
- Coordinate with ITRS Analytics administrators to discuss cardinality limits, retention policies, and ingestion quotas before publishing large-scale data.
ITRS Analytics Ingestion Proxy Copied
Ingestion proxy can be used to funnel data from locally running Gateways and Netprobes to remote ITRS Analytics ingestion services.
By implementing a proxy server, Netprobes and Gateways can connect internally to the proxy, which facilitates a secure outbound connection to hosted ITRS Analytics instances. It can be used for your instance or to connect to the SaaS instance. This method improves security by reducing the risk involved in directly connecting the network to external connections. This also allows data-twinning to multiple ITRS Analytics instances.
The ingestion proxy consists of the Collection Agent and gRPC plugin which receive data from Gateways and Netprobes, and report it to one or more ITRS Analytics instances.

Set up the Collection Agent as a proxy server Copied
Configure the gRPC plugin Copied
Configure your gRPC plugin using the following reference configuration. For the proxy server to work, provide values on the collectors and reporters parameters. Ensure values for the following are provided:
- `collectors` > `port`
- `reporters` > `tcp` > `hostname` and `port`
- `reporters` > `ingestion-reporter` > `hostname`, `port`, `username`, and `password`
plugin-directory: ${env:COLLECTION_AGENT_DIR}/plugins

monitoring:

  # Optional. Defaults to true.
  enabled: true

  # Agent self metrics.
  self-metrics:

    # Whether to enable self metric collection (optional, defaults to true).
    enabled: true

    # Dimensions to add to all self metrics from this agent (optional).
    dimensions:
      app: ingestion-proxy

collectors:
  - name: internal-grpc
    type: plugin
    class-name: GrpcInternalIngestionServiceCollector
    port: ${env:GRPC_PORT}
    # Optional. Settings to allow password authentication of Gateway
    # Remove the authentication section if you do not require gateways to authenticate with the proxy
    authentication:
      iam:
        scheme: https
        hostname: ${env:IAM_HOST}
        # port:  ${env:IAM_PORT}
        client-id: ingestion
        client-secret: ${env:IAM_CLIENT_SECRET}
        # the following setting is required, even though it will not be used
        admin-realm: master
        client-realm: obcerv
      allowed-users: [ ingestion-api ]
    thread-pool-size: 2

    # Optional. Use to enable TLS.
    # Remove the tls-config section if you do not require TLS connections between the gateway and the proxy
    tls-config:
      cert-file: ${env:PROXY_CERTIFICATE}
      key-file: ${env:PROXY_KEY}

reporters:
  - type: tcp
    name: tcp
    hostname: ${env:TCP_REPORTER_HOST}
    port: ${env:TCP_REPORTER_PORT}

  - type: plugin
    class-name: GrpcInternalIngestionServiceReporter
    name: ingestion-reporter

    hostname: ${env:INGESTION_HOST}
    port: ${env:INGESTION_PORT}
    username: ${env:INGESTION_USER}
    password: ${env:INGESTION_PWD}

    # Optional. Switch compression on/off. Defaults to true.
    use-compression: true

    # Optional. gRPC call deadline in milliseconds. Defaults to 3000ms.
    call-deadline: 3000

    # use-plain-text: true

    # Optional. Used only when use-plain-text is false (the default) and mTLS is desired,
    # else the client trusts whatever public key it receives from the server during the
    # TLS handshake.
    tls-config:
    # # Optional. Used for mTLS and trusted server TLS (i.e. contains trusted server keys).
      trust-chain-file: ${env:OBCERV_CA_CERTIFICATE}
    #   # Optional. List of TLS protocols to enable. Defaults to TLSv1.3 and TLSv1.2 only.
    #   protocols: [ TLSv1.3, TLSv1.2 ]

    # Optional. Explicitly switch on/off grpc level retries. Defaults to no explicit setting and therefore grpc default.
    # Unable to find property 'grpcRetries' on class: com.itrsgroup.collection.plugins.grpc.reporters.ingestion.GrpcInternalIngestionServiceReporterConfig$Batch
    # grpc-retries: true

    # Optional. Set a grpc idle timeout. Default is to not explicit set an idle timeout which means the channel
    # inherits the default, which is currently 30 minutes.
    # grpc-idle-timeout: 100000000

    #
    # Batch configuration per endpoint type.
    #
    # It is not necessary to configure any batching at all (including the common-batch block)
    # in which case the defaults are as specified in the common-batch block.
    #
    # Endpoint specific batch configuration can be used to override the default and common-block
    # attributes.
    #

    # Optional. Common batch configuration for all endpoints unless overridden below.
    common-batch:
      # Optional. In memory buffer capacity. Defaults to 2 * the batch size. Must be greater than the batch size.
      # A larger in memory buffer gives some level of protection against a receiver that is either generally slow, or
      # is slow to recover after a transient outage AND the producer is not producing at a significantly higher rate than
      # can be handled by the receiver.
      # buffer-capacity: 2048

      # Optional. Switch on asynchronous reporting. Defaults to false.
      # In asynchronous mode batches are sent without awaiting completion of the previous batch which allows for
      # interleaved reporting. This results in higher throughput at the cost of batches potentially being received out
      # of order.
      # async-mode: false

      # Optional. Retry interval in milliseconds when in synchronous reporting mode. Defaults to 500 ms.
      # retry-interval: 500

    # Optional. Override metrics batch configuration.
    # If present then any common configuration is ignored (i.e. individual attributes are not inherited).
    metrics-batch:
      size: 500
      timeout: 200
      max-retries: 0

    # Optional. Override logs batch configuration.
    # If present then any common configuration is ignored (i.e. individual attributes are not inherited).
    logs-batch:
      size: 100
      timeout: 1000
      max-retries: 10

    # Optional. Override events batch configuration.
    # If present then any common configuration is ignored (i.e. individual attributes are not inherited).
    events-batch:
      size: 100
      timeout: 1000
      max-retries: 10

    # Optional. Override attributes batch configuration.
    entity-attributes-batch:
      size: 500
      timeout: 1000
      max-retries: 10

  - type: routing
    name: routing-table
    route-eviction-timeout: 2000
    route-restoration-timeout: 60000
    route-type: all
    ignore-no-matching-route: true
    routes:
      - reporter: ingestion-reporter
        do-not-evict: true
        match: any
        matchers:
          - type: property
            key: gateway
            pattern: .*
      - reporter: tcp
        do-not-evict: true
        match: all
        matchers:
          - type: dimension
            key: app
            pattern: ingestion-proxy
          - type: property
            key: gateway
            pattern: .*
            exclude: true

workflow:
  metrics:
    reporter: routing-table
    max-retries: 0
    pass-through:
      enabled: true
      concurrency: parallel
      fire-and-forget: true

  logs:
    reporter: routing-table
    max-retries: 0
    pass-through:
      enabled: true
      concurrency: parallel
      fire-and-forget: true

  events:
    reporter: routing-table
    max-retries: 0
    pass-through:
      enabled: true
      concurrency: parallel
      fire-and-forget: true

  attributes:
    reporter: routing-table
    max-retries: 0
    pass-through:
      enabled: true
      concurrency: parallel
      fire-and-forget: true
  traces:
    enabled: false
Start the ingestion proxy Copied
- Use the include file ingestion-proxy.sh to start the proxy.
Note
Ensure thatingestion-proxy.shandingestion-proxy.yamlare in the same directory. Additionally, ensure that there is a Collection Agent directory that contains the Collection Agent and the Collection Agent plugin directory. This can be done by copying the collection-agent directory from the Netprobe package.
- Edit the bash script:
| Variable | Description |
|---|---|
| INGESTION_HOST | DNS name of the ITRS Analytics ingestion server (for example,ingestion-iax.example.com). |
| INGESTION_USER | User the proxy will use when connecting to ITRS Analytics. |
| INGESTION_PWD | Password the proxy will use when connecting to ITRS Analytics. |
| OBCERV_CA_CERTIFICATE | Certificate used to validate the connection to ITRS Analytics. Leave this blank if the certificate is trusted by the machine. |
| PROXY_CERTIFICATE | Name of the file that contains the proxy server certificate (required to establish a TLS connection between gateways and the proxy). |
| PROXY_KEY | Name of the file that contains the proxy server private key in pkcs8 format (required to establish a TLS connection between gateways and the proxy). |
| GRPC_PORT | Port that the Ingestion proxy will listen on for gRPC connections. |
| IAM_HOST | Hostname of ITRS Analytics used to allow the proxy server to validate the username and password supplied by a gateway when it connects (for example, iax.example.com). |
| IAM_CLIENT_SECRET | Client secret of the ingestion client in ITRS Analytics. |
| TCP_REPORTER_HOST | Hostname of the server that the monitoring Netprobe resides upon. |
| TCP_REPORTER_PORT | Port that the monitoring Netprobe is using to listen for a Collection Agent TCP connection. |
| COLLECTION_AGENT_DIR | Directory where the Collection Agent and the Collection Agent plugin directory reside. |
OPTIONAL: Disable gateway authentication
Remove IAM_HOST and IAM_CLIENT_SECRET fromingestion-proxy.shand remove the iam-config block in the internal-grpc collector iningestion-proxy.yaml.
OPTIONAL: Disable TLS connections between gateway and the proxy
Remove PROXY_CERTIFICATE and PROXY_KEY. Additionally, remove the tls-config block in the internal-grpc collector iningestion-proxy.yaml.
Set up Gateway to establish a connection with ITRS Analytics Copied
The include file obcerv-via-proxy.xml allows Gateways to connect to ITRS Analytics via the proxy. This file should be used by all Gateways that publish to ITRS Analytics. Refer to Include files for guidance on setting up include files in the Gateway Setup Editor.
Change the following settings based on the location and changes to the Collection Agent proxy:
hostnameandportof the ingestion service (Publishing > service address)locationof the proxy server certificate (if required) (Publishing > Root certificates)
Note
Data access is either direct or via a normal HTTP proxy that supports HTTP/2 and needs to be set in the file.
To start the connection between Gateway and ITRS Analytics, configure the Publishing > ITRS Analytics connection settings in the Gateway Setup Editor. Refer to the ITRS Analytics connection configuration section.
You need to fill in the Data access section in order to use Gateway Commands, Adaptive Rules, or the Forecaster app in ITRS Analytics. Your ITRS Analytics connection settings should look like this:

Connect Netprobe to Collection Agent (Monitoring Proxy Service) Copied
The include file ingestion-proxy-monitoring.xml is for monitoring the ITRS Analytics proxy service. Only one Gateway needs this file, which will be the sole Gateway that will monitor the ITRS Analytics proxy. It also requires a Netprobe which will run on the server specified in ingestion-proxy.sh.
Note
- The probe host of the Netprobe should be updated to match the server used (TCP_REPORTER_HOST).
- The port where the Gateway connects to the Netprobe should match the port that the Netprobe listens on (-port flag).
- The port that the Netprobe listens to for tcp connections from the Collection Agent should be changed to match the port defined in
ingestion-proxy.sh(TCP_REPORTER_PORT).
The include file ingestion-proxy-monitoring.xml contains the following sections:
-
Mapping — a Dynamic Entity mapping named
Ingestion-proxywhich processes the following custom mappings:-
Filters — determine which datapoints are processed by which mapping. Values set are:
- Label — app
- Options — equals
- Value — ingestion-proxy
Note
The values are similar to the TcpReporter you previously defined.
-
Geneos items — when a mapping is applied, the Geneos items fields determine how the labels of each datapoint are used to create Dynamic Entities and other items in the Geneos tree structure. Values set are:
- Labels — hostname, app
- Options — entity, sampler
- Entity — when
entityis set in options, value in this field is: Required: true, Use in display name: trueNote
The dimensions and properties of datapoints are both referred to aslabelswhen creating custom mappings.
-

- Collection Agent parameters — an unmanaged Collection Agent parameter named
Ingestion Proxywhich defines how the Collection Agent should run. The value of the Reporter port is19137, which is the port the Netprobe should listen on to communicate with the Collection Agent using the TcpReporter.

- Mapping type — a mapping type named
Ingestion proxy, wherein the mappingIngestion-proxyis specified.

Adding a new probe Copied
Set up a new probe following the steps below:
-
Create a new probe and provide the name, hostname, and port.

-
Select the Dynamic Entities tab. Specify the mapping type and Collection Agent parameters that the Netprobe must use.

You should now be able to check the data coming in from the Collection Agent Ingestion Proxy through your Active Console.

Troubleshooting ITRS Analytics connectivity Copied
This section provides systematic troubleshooting steps for common ITRS Analytics publishing issues.
Diagnostic checklist Copied
When experiencing any ITRS Analytics publishing issue, systematically check:
- Gateway version — Gateway 7.0.0 or later is required. Gateway versions prior to 7.0.0 are not supported for ITRS Analytics publishing and may cause connection failures.
- Self-monitoring dataviews — review all metrics under Gateway Info > ITRS Analytics.
- Gateway logs — search for “ITRS Analytics”, “gRPC”, or “ingestion” errors.
- Connection status —
connectionStatusshould beReady, notTransient FailureorShutdown. - Infrastructure support — all network devices support gRPC and HTTP/2.
- Certificates — properly configured and not expired.
- Credentials — correct username/password with appropriate permissions, or a valid API token that is not expired.
- Proxy — if used, correctly configured and supports gRPC.
- Strategies — not filtering required data.
- Data types — explicit schemas defined for published dataviews.
- Data volume — within expected limits (use
statisticsOnlymode to test). - Network path — no firewalls blocking outbound HTTPS.
- ITRS Analytics health — ingestion service operational (check with ITRS Analytics administrator).
Common examples of connection issues Copied
Symptom: Connection failures or publishing errors with older Gateway versions Copied
- Cause: Gateway versions prior to 7.0.0 are not supported for ITRS Analytics publishing.
- Solution: Upgrade to Gateway version 7.0.0 or later.
Symptom: connectionStatus shows Transient Failure message Copied
Possible causes and solutions:
-
HTTP/2 or gRPC not supported by infrastructure
- Check: Verify all load balancers, proxies, and network devices between Gateway and ITRS Analytics support HTTP/2 and gRPC.
- Solution: Review network infrastructure requirements and enable gRPC on all intermediate devices.
-
Certificate issues
- Check: Look for SSL/TLS errors in Gateway logs.
- Solution: Verify certificate configuration in Root certificates.
- Common issues:
- Certificate expired.
- Wrong certificate (server cert instead of CA cert).
- Certificate format incorrect (not PEM).
- Certificate path incorrect.
-
Network connectivity
- Check: Can the Gateway host reach the ingestion service?
- Firewall: Ensure outbound HTTPS (port 443) is allowed.
- DNS: Verify the ingestion hostname resolves correctly.
-
Proxy misconfiguration
- Check: If using a proxy, verify proxy configuration is correct.
- Solution: Test proxy connectivity separately.
- Common issues:
- The proxy doesn’t support gRPC/HTTP/2.
- The proxy authentication credentials are incorrect.
- The proxy hostname or port is wrong.
-
Incorrect credentials
- Check: Look for authentication errors in Gateway logs.
- Solution: Verify credentials in publishing credentials.
- Test: Try the same credentials via ITRS Analytics web console.
- Common issues:
- Wrong username/password.
- Account doesn’t have ingestion permissions.
- Account disabled or expired.
Symptom: Data not appearing in ITRS Analytics Copied
Possible causes and solutions:
-
Publishing is disabled or in
statisticsOnlymode- Check: Verify that the Mode is set to
connection, notstatisticsOnly. - Check: Verify that the Enabled setting is checked.
- Check: Verify that the Mode is set to
-
Data filtered by strategies
- Check: Review strategies configuration.
- Solution: Check if your dataviews match exclude filters or don’t match include filters.
- Test: Temporarily remove all strategies to verify data flows without filters.
-
Data throttled
- Check:
dataviewsUnpublishedin self-monitoring summary dataview. Dataviews without severity are throttled by default for 20 seconds. - Solution: Adjust throttle setting or add severity to cells you want published at full rate.
- Check:
-
Schemaless dataview type mismatches
- Check:
metricsDropped> 0 in self-monitoring summary dataview. Dataview cells changing types (number ↔ string) cause metrics to be dropped. - Solution: Define explicit schemas for dataviews.
- Check:
-
Messages dropped due to queue overflow
- Check:
messagesDroppedPerSample> 0 in self-monitoring detail dataview. If so, data generation rate exceeds the transmission rate. - Solutions:
- Reduce data volume by using filters.
- Increase queue size.
- Investigate network bandwidth limitations.
- Check ITRS Analytics ingestion rate limits.
- Check: