Azure Event Hub
Overview Copied
The Azure Event Hub collector is a Collection Agent plugin that gets metrics and platform logs events from an Azure Event Hub and then translates them into Collection Agent datapoints. This collector uses the Azure Java SDK to consume event hub messages and publishes them to a Netprobe. Then it displays data as dataview in Geneos for metrics or as stream for platform logs.
The Azure Event Hub collector comes with the Azure plugin binaries. In order to use the Azure Event Hub collector, you only need to add the configuration settings in the Collection Agent YAML file, and create an Event Hub in your Azure Portal. See Azure Event Hub deployment.
Deployment recommendations Copied
Azure plugin supports the ability to consume real-time metrics and platform logs from the Azure Event Hub service. This is an alternative to polling Azure Monitor API, enabling Geneos to monitor your Azure cloud environment at scale and in real-time.
Use the Azure Event Hub deployment option in the following cases:
- If you have Azure diagnostics set up to publish metrics and platform logs to an Event Hub, you may want to use the Azure Event Hub collector for gathering metrics and platform logs. This provides a higher throughput of metrics and platform logs which is one way to avoid issues caused by Azure API limitations.
- Your Azure Monitor API usage is near the hourly API limit as your Azure estate grows larger. The best approach to preventing this is identifying the priority of services and resources that you want to monitor, and then slowly migrating them to Event Hub streaming to use the Azure Event Hub collector. The Azure Event Hub collector can also be used in different scenarios. For more information, see Advanced usage of Azure Event Hub.
Prerequisites Copied
Geneos environment Copied
The Azure plugin and Azure Event Hub collector has the same Geneos environment requirements. See Geneos environment in Azure.
Azure environment Copied
The Azure Event Hub collector requires the following:
- An Event Hub in your Azure Portal that is receiving diagnostics metrics and platform logs from Azure services. For more information on how to create an event hub using Azure portal, see the Azure Event Hub Quickstart guide.
- Open outbound ports to both HTTPS and AMQP. See Azure Event Hub ports.
Note
You may configure authentication for the port connection to meet your security requirements, but you need to provide the connection string to the collector. See connection string from Azure.
You can also configure a consumer group if you want to use a consumer group for the Azure Event Hub collector. If you do not create a consumer group the default consumer group will be used. There should be one consumer group per consumer.
The Azure Event Hub collector will read all messages from an Event Hub, but it will only process messages that contain metrics and platform logs data published by Azure.
Deploy Azure Event Hub Copied
If you have not set up the Azure plugin, you can refer to the Configure Geneos to deploy Azure Monitor. The set up process is similar.
To set up the Azure Event Hub collector:
- You must edit the
collection-agent.ymlfile on your local machine, where the binaries are stored, and add the configuration settings below:
collectors:
  - name: eventhub
    type: plugin
    className: AzureEventHubCollector

    # Connection string of the Azure Event Hub namespace (optional if using token credentials)
    # This will be used if both connection string and fully qualified namespace are provided.
    connectionString: ${env:EVENT_HUB_CONNECTION_STRING}

    # Fully qualified namespace of the Azure Event Hub instance (required if using token credentials)
    # This will be ignored if a connection string is provided.
    fullyQualifiedNamespace: ${env:FULLY_QUALIFIED_NAMESPACE}

    # Instance name of the Azure Event Hub namespace (required)
    eventHub: ${env:EVENT_HUB_NAME}

    # Consumer group name of the Azure Event Hub instance (required)
    consumerGroupName: ${env:CONSUMER_GROUP_NAME}

    # The Azure client credentials that can be used for this application (optional, needed to extract metric primary aggregation type)
    tokenCredentials:
      clientId: <FILL UP>
      clientSecret: <FILL UP>
      tenantId: <FILL UP>
- Set your mappings in the Gateway. Follow the procedures in Create Dynamic Entities in Collection Agent setup. Then, select Azure Monitor V3 in the Built in > Name section.
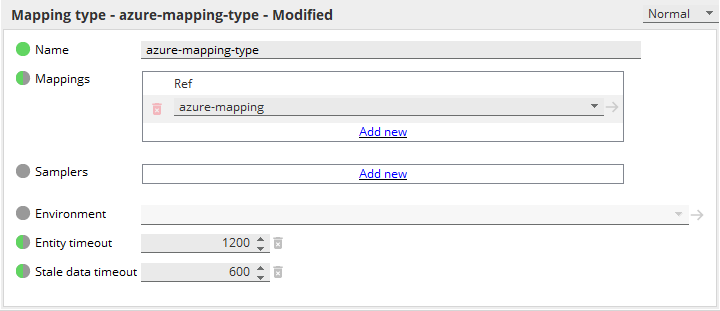
- Link your mapping type to the recently created Azure mapping.
- Enable your dynamic managed entities. For reference, see Add a Mapping type in Dynamic Entities.
Note
To check if there are any errors in the mappings, you can set up the Dynamic Entities Health, or look at the Collection Agent log file.
Once you set up the collector and the mappings successfully, the Azure Event Hub collector metrics will be displayed in a dataview in Geneos.

Adjust entity and stale data timeout Copied
Events may be published at different rates. This can cause stale data or missing entities if the publishing rate is slow. If this happens, you can adjust the Entity timeout and Stale data timeout fields in the Dynamic Entities > Collection Agent parameters section in the GSE.
Monitor Azure platform logs using FKM Copied
You can set up the File Keyword Monitor sampler in GSE to monitor the Azure platform logs.
- Open Gateway Setup Editor to create an FKM sampler.
- In Files > Source, select
streamand then add the Azure resource name you want to monitor. For the list of Azure resources, see Monitored Azure services in Azure. You can either use a wildcard or specify the resource name followed by a wildcard.Note
A wildcarded stream is only supported when the stream is coming from REST API while FKM also supports the stream coming from Collection Agent. See files > file > source > stream in File Keyword Monitor.- Use a wildcard
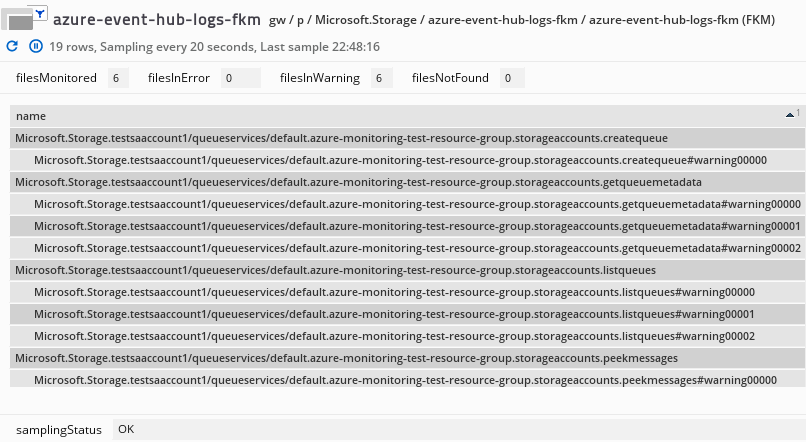
*in the Source > stream name.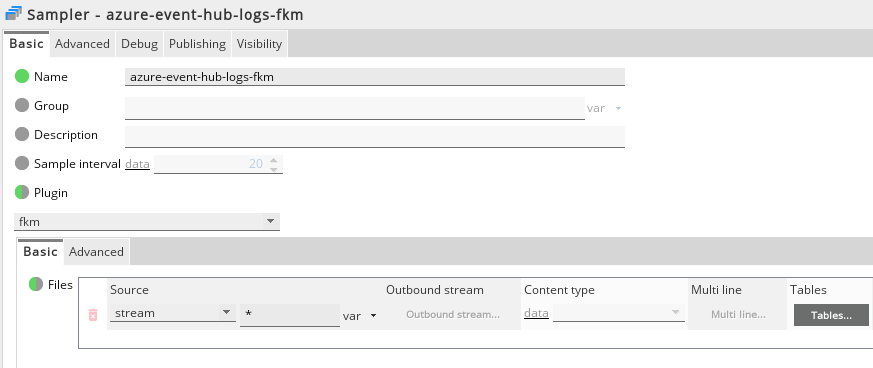 This displays all available platform logs from the Azure Event Hub:
- In the Source > stream name, specify the resource name followed by a wildcard:
resource-name*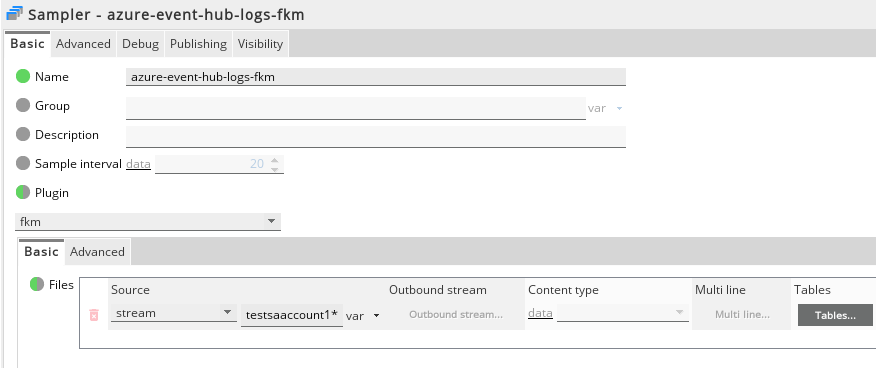 This displays the platform logs of the selected Azure resource:
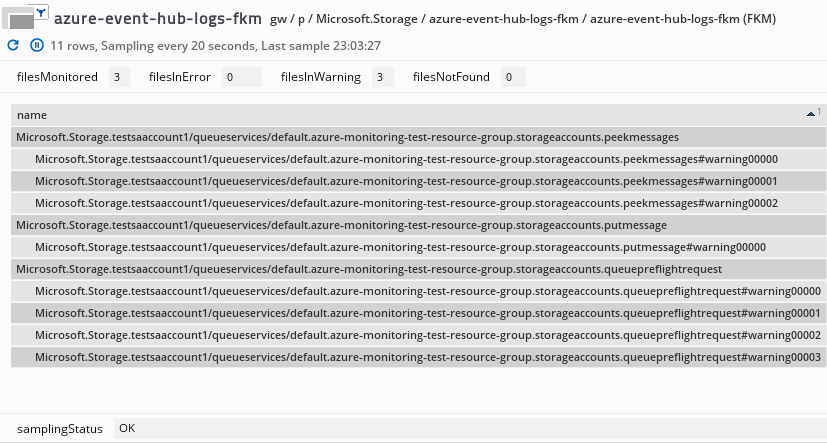
- Use a wildcard
Monitor Azure alert messages using FKM Copied
Azure can be configured to generate alert notifications based on metrics, logs, and activity logs. Some alerts are automatically generated, such as service alerts and activity alerts.
The Azure plugin allows you to consume the alert notifications into Geneos to gain visibility of Azure alerts alongside Geneos alerts. Azure applies a common alert schema for all alert notifications. The schema has two sections:
- Essentials — well-structured data, which you can also turn into a log event for Geneos.
- Alert Context — this structure depends on the type of alert and can contain a large amount of data.
Note
Alert Context is a section of the common alert schema that is not currently handled by the Azure plugin. This means that metrics from the Alert Context schema are ignored, and are not parsed or consumed by the Collection Agent.
When creating Azure Alerts and Action, the common alert schema should be enabled (which is already enabled by default) in order for Azure to parse the schema. Below is an example schema:
{
    "schemaId": "azureMonitorCommonAlertSchema",
    "data": {
      "essentials": {
        "alertId": "/subscriptions/b8bfd956-91cb-4141-ba71-a3acf4adb357/providers/Microsoft.AlertsManagement/alerts/40c9641c-8c2b-47a3-bbed-5e79dc5d79bd",
        "alertRule": "testSAAlertRule",
        "severity": "Sev4",
        "signalType": "Activity Log",
        "monitorCondition": "Fired",
        "monitoringService": "Activity Log - Administrative",
        "alertTargetIDs": [
          "/subscriptions/b8bfd956-91cb-4141-ba71-a3acf4adb357/resourcegroups/azure-monitoring-test-resource-group/providers/microsoft.storage/storageaccounts/mgsantostestsa"
        ],
        "configurationItems": [
          "mgsantostestsa"
        ],
        "originAlertId": "6ab0f27d-6dcf-436c-8d7e-055f81c2cc79_c37da2c5b39999dfa0a91fc6db92b3c4",
        "firedDateTime": "2022-03-28T07:52:55.1448188Z",
        "description": "Alert Rule for mgsantostestsa",
        "essentialsVersion": "1.0",
        "alertContextVersion": "1.0"
      },
      "alertContext": {
        "authorization": {
          "action": "Microsoft.Storage/storageAccounts/listKeys/action",
          "scope": "/subscriptions/b8bfd956-91cb-4141-ba71-a3acf4adb357/resourcegroups/Azure-Monitoring-Test-Resource-Group/providers/Microsoft.Storage/storageAccounts/mgsantostestsa"
        },
        "channels": "Operation",
        "claims": "{\"aud\":\"https://management.core.windows.net/\",\"iss\":\"https://sts.windows.net/7f832d77-99ba-488d-9dc9-15463f07671b/\",\"iat\":\"1648449506\",\"nbf\":\"1648449506\",\"exp\":\"1648454898\",\"http://schemas.microsoft.com/claims/authnclassreference\":\"1\",\"aio\":\"AVQAq/8TAAAAwXu0/1ZDC94MpzoukkIEODmAYACELp2zS1l4T4+Wk4wcWJtZeE/WyKDgrF4Osi8f2oUIImUA3FQdXp+FSe8FK/lDORAHgzKjv8T5SQNsQGI=\",\"http://schemas.microsoft.com/claims/authnmethodsreferences\":\"pwd,mfa\",\"appid\":\"c44b4083-3bb0-49c1-b47d-974e53cbdf3c\",\"appidacr\":\"2\",\"http://schemas.xmlsoap.org/ws/2005/05/identity/claims/surname\":\"Santos\",\"http://schemas.xmlsoap.org/ws/2005/05/identity/claims/givenname\":\"Mark Anthony\",\"groups\":\"69ab58d9-e46e-4f9d-9a33-2b6ccd7e07a8\",\"ipaddr\":\"112.207.78.200\",\"name\":\"Mark Anthony G. Santos\",\"http://schemas.microsoft.com/identity/claims/objectidentifier\":\"0f4cff1e-708c-4a62-a7c6-fdcdc67d7692\",\"puid\":\"1003BFFDA0ACE9EE\",\"rh\":\"0.AXQAdy2Df7qZjUidyRVGPwdnG0ZIf3kAutdPukPawfj2MBN0AE0.\",\"http://schemas.microsoft.com/identity/claims/scope\":\"user_impersonation\",\"http://schemas.xmlsoap.org/ws/2005/05/identity/claims/nameidentifier\":\"183_dQ6Vo4bpDWk3-IG27c8nwA-gP19LMywo89vdJlg\",\"http://schemas.microsoft.com/identity/claims/tenantid\":\"7f832d77-99ba-488d-9dc9-15463f07671b\",\"http://schemas.xmlsoap.org/ws/2005/05/identity/claims/name\":\"mgsantos@itrsgroup.com\",\"http://schemas.xmlsoap.org/ws/2005/05/identity/claims/upn\":\"mgsantos@itrsgroup.com\",\"uti\":\"hfCWu9ofqE69BILmK55KAA\",\"ver\":\"1.0\",\"xms_tcdt\":\"1396943179\"}",
        "caller": "mgsantos@itrsgroup.com",
        "correlationId": "294faab2-1228-42c9-8658-57b9144016b2",
        "eventSource": "Administrative",
        "eventTimestamp": "2022-03-28T07:51:37.5578652",
        "httpRequest": "{\"clientRequestId\":\"61445e56-8a1b-4f45-96ba-3b31423ba05a\",\"clientIpAddress\":\"112.207.78.200\",\"method\":\"POST\"}",
        "eventDataId": "6ab0f27d-6dcf-436c-8d7e-055f81c2cc79",
        "level": "Informational",
        "operationName": "Microsoft.Storage/storageAccounts/listKeys/action",
        "operationId": "a8cc9df4-bb20-4143-87a4-783b5c5f5a6f",
        "properties": {
          "statusCode": "OK",
          "serviceRequestId": null,
          "eventCategory": "Administrative",
          "entity": "/subscriptions/b8bfd956-91cb-4141-ba71-a3acf4adb357/resourcegroups/Azure-Monitoring-Test-Resource-Group/providers/Microsoft.Storage/storageAccounts/mgsantostestsa",
          "message": "Microsoft.Storage/storageAccounts/listKeys/action",
          "hierarchy": "7f832d77-99ba-488d-9dc9-15463f07671b/b8bfd956-91cb-4141-ba71-a3acf4adb357"
        },
        "status": "Succeeded",
        "subStatus": "OK",
        "submissionTimestamp": "2022-03-28T07:52:46.1903089",
        "Activity Log Event Description": ""
      },
      "customProperties": null
    },
    "EventProcessedUtcTime": "2022-03-28T07:58:43.2577419Z",
    "PartitionId": 1,
    "EventEnqueuedUtcTime": "2022-03-28T07:53:04.7000000Z"
  }
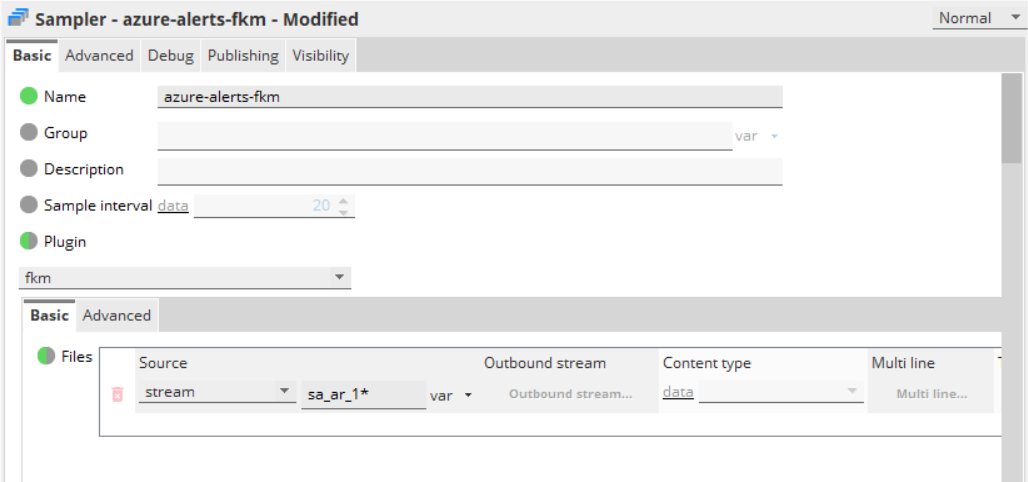
In Gateway Setup Editor, you can add the Azure alert name you want to monitor. You can either use a wildcard or specify the alert name followed by a wildcard.
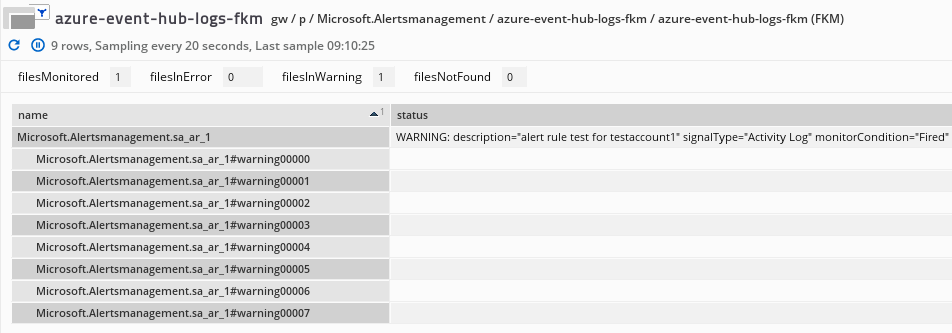
Below is an example dataview:
Advanced usage of Azure Event Hub Copied
This section provides you some scenarios where using the Azure Event Hub collector can be more helpful to your monitoring.
Filter datapoints published to the Netprobe Copied
The Azure Event Hub collector will process all diagnostics metrics and platform logs, and then metrics are sent to the Netprobe for publishing. By default, all metrics read will be sent over, but you can filter which datapoints will be sent to the Netprobe using a workflow. A Collection Agent workflow allows the use of several processors that can be applied to datapoints before these are published. See Collection Agent configuration reference.
For example, if you want to use a drop-filter to drop all metrics that start with Bytes, then add these configuration settings to the Collection Agent YAML file:
workflow:
  storeDirectory: .
  metrics:
    reporter: tcp
  events:
    reporter: tcp
  common:
    processors:
      # use a drop-filter to drop all metrics that start with "Bytes"
      - type: drop-filter
        matchers:
          - type: name
            namePattern: Bytes.*
If you want to use a forward-filter to only publish metrics from a specific resource_group, you can use this pattern to further filter by other dimensions (as shown in Show Dynamic Mappings):
workflow:
  storeDirectory: .
  metrics:
    reporter: tcp
  events:
    reporter: tcp
  logs:
    reporter: tcp
  common:
    processors:
      # Use a forward-filter to only publish metrics from a specific resource_group.
      # You can use this pattern to further filter by other dimensions (as shown in Show Dynamic Mappings)
      - type: forward-filter
        matchers:
         - type: dimension
           key: resource_group
           value: Presales-RG
Monitoring events Copied
When setting up the Netprobe and Collection Agent to connect to an Event Hub, it is useful to also monitor the incoming and outgoing messages in the Event Hub metrics. In an ideal scenario incoming and outgoing messages are mostly equal, which means that events are read by the Azure Event Hub collector almost immediately.
Note
The load that the Azure Event Hub collector can consume will vary depending on several factors, such as the processing power of the machine the Netprobe is running on.
You can reduce incoming messages to an Event hub by splitting diagnostics across different services or resource groups, and ensuring that only Azure diagnostics metrics are being published.
Azure Event Hub self monitoring Copied
The Azure Event Hub collector also provides self-monitoring metrics, indicating the collector name, Event Hub name, consumer group, a few indications of events processed successfully, and events dropped (indicating non-metrics events):

This dataview is created based on the following dimensions and their mappings:
subscription_id: Azure subscription IDresource_group: Azure Event Hub Collectorresource_type: selfMonitoringresource_provider: ITRS
Note
The self-monitoring dynamic entity for Azure Event Hub is created only after the first event is processed.
The selfMonitoring dynamic entity displays a dataview that has the following metrics:
| Field | Description |
|---|---|
| event_hub_name | Name of event hub. |
| consumer_group | Name of consumer group of the event hub instance. |
| events_processed_per_collection_interval | Number of events processed per collection interval. |
| events_processed_per_hour | Number of events processed per hour. This metric resets every start of the hour (xx:00). |
| events_dropped_per_collection_interval | Number of events dropped per collection internal. |
| events_dropped_per_hour | Number of events dropped per hour. This metric resets every start of the hour (xx:00). |
Monitor multiple event hubs Copied
You can also setup multiple Azure Event Hub collectors, either in the same Collection Agent instance, or in several Collection Agents. This may be useful when spreading the load across multiple Event Hubs, or multiple Netprobes.
However, if you plan to set up multiple Azure Event Hub collectors connecting to the same Event Hub instance, then you should create individual consumer groups for each collector.
In the example below, the name for each Event Hub must be unique.
  - name: eventhub-synthetic
    type: plugin
    className: AzureEventHubCollector
    connectionString: "connection_string"
    eventHub: "mnleventhub-1"
    consumerGroupName: "$Default"
  - name: eventhub-actual
    type: plugin
    className: AzureEventHubCollector
    connectionString: "connection_string"
    eventHub: "insights-metrics-pt1m"
    consumerGroupName: "$Default"
  - name: eventhub-central
    type: plugin
    className: AzureEventHubCollector
    connectionString: "connection_string"
    eventHub: "central-eventhub-1"
    consumerGroupName: "$Default"