Introduction
What is Geneos? Copied
Geneos is a real-time monitoring tool that enables organizations to gain insights into the overall health of their business operations or processes. It offers a comprehensive view of applications on a single platform.
Geneos was designed with financial services companies in mind to meet their challenging IT infrastructures. Geneos is primarily used by financial institutions such as banks, brokers, hedge funds, exchanges, energy traders, and data vendors.
The Geneos product operates using a three-tier architecture, collecting and processing data from various sources based on defined configurations. These configurations utilize pre-configured plugins and integrations that seamlessly integrate with different technologies. Once collected, data is processed to allow organizations to understand their systems, identify irregularities or notable changes, and be presented visually through dashboards for analysis and early problem detection. This architecture is fundamental to Geneos’ ability to effectively monitor IT infrastructure. For a more detailed explanation of this architecture, see Archictecture section.
In essence, Geneos provides organizations with peace of mind through its real-time monitoring of business functions across backend and frontend systems, precise data collection, and accurate reporting. This guarantees that critical business functions always remain operational and smooth-running.
Set up Geneos Copied
There are several options for setting up Geneos to match your specific business requirements. For a quick overview of flexible deployment options, see the Quickstart Guide.
If you need details about compatible operating systems and other requirements, refer to the Geneos compatibility matrix.
Key features and basic user interface Copied
This section will guide you through the core functionalities and basic user interface of Geneos. This highlights the key features that make Geneos ideal for real-time monitoring and familiarizes you with the intuitive user interface designed for ease of use. Whether you are new to Geneos or want to learn more, this guide will help you understand how to use Geneos to its fullest.
Build dashboards and visualizations with Active Console Copied
Active Console is a vital part of the Geneos architecture, alongside Gateway and Netprobe. It enables you to connect to and view the content of Geneos Gateways. It has an easy-to-use graphical user interface with real-time monitoring and control tools, such as rules, commands, and alerts.
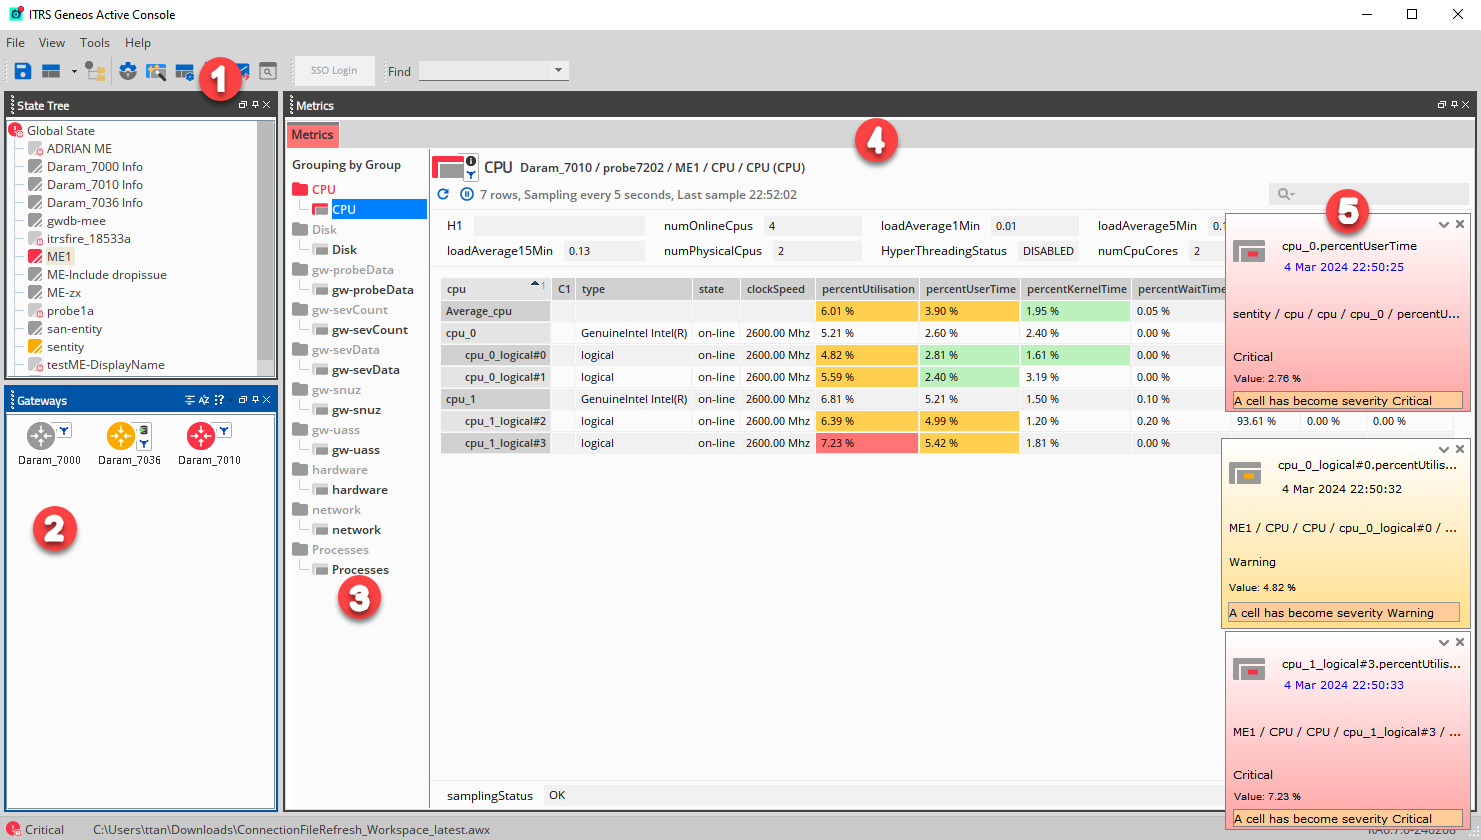
When you launch an Active Console and create a new workspace, it shows a layout with the following dockables:
| Number | Dockables/View | Description |
|---|---|---|
| 1 | State Tree | Shows a hierarchical view of your monitored environment |
| 2 | Gateways | Shows a list of Gateways that Active Console is configured to connect to. |
| 3 | Managed Entities | Shows a logical grouping of related metrics. |
| 4 | Metrics | Shows a tabular view of metrics. |
| 5 | Event Tickers | Shows a list of important events. |
After setting up your Active Console, you can proceed to connect and configure your Gateway.
Manage configurations through the Gateway Setup Editor Copied
The Gateway Setup Editor (GSE) is used to configure Gateways. The setup file is in XML format, and the GSE has an integrated XML editor that you can use to change it.
You can customize GSE based on your business needs. The typical configurations include:
-
Connecting to various plugins and integrations, facilitating smooth integration with your key financial industry applications and other third-part products.
-
Setting up alerts to warn you of potential issues before they affect your business, and enabling automation to address these issues effectively.
The easiest way to edit a Gateway is to double-click the Gateway icon in the Gateways dockable to open the GSE.
Note
Gateways can be connected to multiple Active Consoles.
There are various components that make up the GSE. Every component has a dockable frame of its own.
| Dockable/View | Description |
|---|---|
| Navigation | Shows the main sections and items in the setup, and controls the Settings editor of the current document. |
| Errors View | Shows a list of validation errors for the current document. |
| Search Results | Shows the search results for the last executed search. |
| Gateways View | Shows any connected Gateways. |
| The Document Area | Shows all the open documents. |
| Settings Editor | Shows the selected section for editing. |
Once your Gateway is configured to collect your selected data, you can use Active Dashboards to build custom dashboards to visualize your data.
Plugins and integrations Copied
Within GSE, there are over 100 built-in plugins and integrations designed to provide comprehensive insight into your technology environment. These plugins enable monitoring and analysis of various system performance metrics, infrastructure information, and the management of system components. They can also facilitate the collection and monitoring of third-party data through APIs. Each plugin and integration provides specific monitoring capabilities and is executed locally by Netprobe or the Collection Agent. Plugins are configured in the samplers.
For a comprehensive list of all Geneos plugins and integrations, see Plugins and Integrations.
Customize Active Dashboards Copied
Active Console allows you to create dashboards within your workspace. A dashboard consists of objects, shapes, widgets, and vector graphics. Dashboards make data simpler by organizing, comparing, displaying only what is needed, allowing you to react and interact based on the provided data.
Active Dashboard can be customized, enabling you to create personalized views of your complex business processes.
To open the Active Dashboard window, go to Active Console > View > Active Dashboards.
You can use the following settings to further customize your dashboards based on your business needs:
| Settings | Description |
|---|---|
| Active Dashboard Palette | Allows you to add contents to a dashboard and create your own tools. |
| Dashboard charts and widgets | Allows you to create, modify, and use different charts from the Widget group in the Active Dashboard Palette. |
| Object Inspector | Allows you to display and edit the style and properties of the selected shapes, and dataset of the charts when an object from the Active Dashboard is selected. |
| Modifiers | Allows you to update the dashboard based on the changes in the Gateways that are being monitored, for example change in fill colour based on the severity of a data item. |
Getting help Copied
Here are some additional resources to help you broaden your knowledge on Geneos.
| Resources | When to use |
|---|---|
| Offline Documentation | Use this if you want to access the documentation offline. |
| Plugins and Integrations | Use this to explore over 100+ preconfigured plugins and integrations and find what suits your needs. |
| What’s New Release Summary |
Use these to stay informed about the most recent developments in Geneos. |
| Online Trainings | Use this if you want to be an expert in using Geneos. |
| Submit a request | Use this to get in touch with our Support team for any specific needs. |