Basisconcepten
In deze sectie leert u over de basisconcepten van Capacity Planner. Deze concepten begrijpen zal het makkelijker maken voor u om deze documentatie te lezen, door het product te navigeren en te communiceren met uw accountvertegenwoordigers over uw Capacity Planner opstelling.
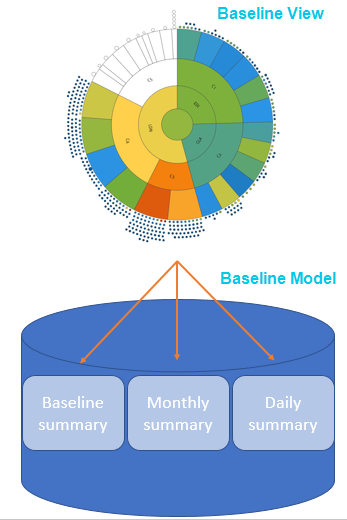
Baseline Copied
Het is belangrijk om onderscheid te maken tussen de volgende termen: baseline view, baseline samenvatting en een model.
Een baseline vertegenwoordigt een datamodel. Elk model is een verzameling van gegevens uit een database en heeft een startdatum en een einddatum. Een Baseline View is een statistische vraagweergave van uw infrastructuur, die het gebruik van middelen over een bepaalde periode samenvat. De standaardweergave is altijd beschikbaar en presenteert typisch een samenvatting van 84 dagen aan gegevens. De weergave is ook waar u kunt kijken naar groeitrends en ruimte voor groei. De primaire visualisatie in de Baseline View wordt de sunburst genoemd. Elk element van de sunburst vertegenwoordigt een onderdeel van uw huidige infrastructuur.
Every project has a default baseline view that presents statistical summaries of all data in a 84 day or 12 week rolling window. Within that model there are a number of summaries. By default, there are three summaries:
- Baseline Summary — a single collection of statistical measures for every entity and metric covering the entire duration of the baseline. This is used by default.
- Monthly Summary — a collection of statistical measures for every entity and metric per calendar month that is covered by the baseline time period.
- Daily Summary — a collection of statistical measures for every entity and metric per day that is covered by the baseline time period.
De Baseline View wordt in de interface gepresenteerd met behulp van de sunburst chart visualisatie.
Baseline View kan op vele manieren worden geconfigureerd om de gegevens op een manier te vertegenwoordigen die het meest logisch is, afhankelijk van uw IT-infrastructuur. Dit wordt bereikt met behulp van groeperingen en groeperingswaarden.
Wanneer u een nieuwe Baseline View vanuit uw model maakt, en u selecteert een nieuwe tijdsperiode voor die weergave, wordt een nieuw model gecreëerd. Uw Baseline View is gebaseerd op dat model. Dat model heeft alle samenvattingen beschikbaar, maar die samenvattingen zijn gebaseerd op de nieuwe tijdsperiode. Dit wordt uitgebreid gebruikt voor maandelijkse rapportage. Typisch zou u een nieuw model creëren dat alle gegevens bevat voor de vereiste kalendermaand en dit dan gebruiken als basis voor rapportage en voorspelling. Als u een nieuwe weergave creëert om een bepaalde maand of andere tijdsperiode vast te leggen, zal deze altijd voor u beschikbaar zijn en zal deze niet veranderen of bijwerken als gevolg van het verkrijgen van nieuwe gegevens in Capacity Planner.
Als u de datums niet wijzigt, en gewoon een nieuwe weergave van het bestaande model maakt, zult u een andere Baseline View hebben op basis van hetzelfde model.
Het creëren van tijdgebonden weergaven op deze manier is de beste manier om een momentopname van de omgeving onbepaald te bewaren.
Voor meer informatie, zie Overzicht van Baseline View.
Benchmark scores Copied
In order to accurately model the relative differences in capability, Capacity Planner uses a concept of benchmark scores.
Each host segment in the Capacity Planner has a calculated industry standard benchmark, the SPECint rate. This benchmark data is produced by the Standard Performance Evaluation Corporation (SPEC). normalises CPU utilisation on each machine to these SPECints. This is the equivalent utilisation expressed as a function of the chipset benchmark score.
Voor meer informatie, zie Benchmarking.
Entiteit Copied
De term entiteit wordt gebruikt om te verwijzen naar een beheerd object in Capacity Planner. Dit is meestal een fysieke server, virtuele machine, virtuele host, netwerkapparaat, interface, virtueel machine schijfbestand of een schijf.
De term wordt voornamelijk gebruikt in Rapportage. Voor meer informatie, zie Geavanceerde rapporten gebruiken.
Groepering Copied
Groupings are slices of data collected by a particular attribute. Each attribute forms a single grouping and is drawn as a ring on your . All rings are concentric, with the centre circle forming its own grouping. Groupings can represent any entity that you wish to monitor in your IT infrastructure, such as physical servers, hosts, clusters, applications, server types, tiers, VM state, and so on.
Default grouping values are automatically uploaded from your Capacity Planner chosen monitoring tool. For example, vCenter and Geneos have tags and attributes, respectively. These are automatically brought into Capacity Planner
Configuring Baseline View using grouping values provides you with the ability to view the summary data for the baseline in a number of ways depending on your business needs. For example, you can arrange the groupings in the Baseline View to view the data by application, by component, or by environment. Adding more groupings to the Baseline View creates a sophisticated view of exactly how your VMs are being tasked across your IT infrastructure to help you make more informed decisions about your business.
Voor meer informatie over het toevoegen, verwijderen en herschikken van groeperingen, zie Groeperingen.
Headroom Copied
Headroom indicates the number of reference VMs that can fit into a server or cluster before running into some capacity constraint. The headroom is based on the currently selected reference VM and host.
Voor meer informatie, zie Headroom.
Percentiel Copied
The percentile figure is the measure defining the amount of time a metric was at a particular value over the course of the baseline used in the scenario. For example, if you pick the 99th percentile for CPU right-sizing, it means that the value used for CPU is the value which the metric has spent 1% of its time at or above over the period of time of the baseline.
Referentiehost Copied
De referentiehost is het meest voorkomende type server dat u in uw omgeving heeft. Het gebruik van een referentiehost betekent dat VM’s in de sunburst worden getekend relatief tot een bepaalde server.
Voor meer informatie, zie Benchmarking.
Referentiewerklast Copied
The Baseline View lets you set a reference host or reference workload. By setting a reference you can better understand your demand profile across your IT infrastructure. The reference workload and host are used for headroom calculations. Changing your reference host or workload, rather than using a calculated average, may mean you get a more accurate view of your IT infrastructure.
Voor meer informatie, zie Referentiewerklast .
Rapporten Copied
Reports are a very powerful and flexible feature of . Among other features, they allow you to:
- Summarise utilisation over any time period that has been modelled for a group of entities.
- Create RAG reports indicating where any breaches may have occurred.
- Analyse relationships between metrics and check how many inactive VMs you have.
- Report on cost trends and recommendations for your cloud environment.
Most reports also provide a drill-through capability to view data at successively lower levels of granularity. They can be run against different entity types (for example, physical servers, virtual machines, or hosts). Reports have configurable parameters to provide maximum flexibility, they can be saved and shared.
Voor meer informatie, zie Geavanceerde rapporten gebruiken.
Right-sizing Copied
Forward Thinking scenario modelling helps you rationalise your IT infrastructure by automatically optimising the vCPU allocation across all workloads under a host or another segment. When you migrate workloads, you get an option to right-size servers after this migration operation is executed. We recommend that you do as this ensures that the VMs created are sized accordingly based on the capabilities of the target hardware platform.
Voor meer informatie, zie Right-sizing
Sunburst weergave Copied
The sunburst is the central part of the screen where your Baseline View or Forward Thinking scenario is visualised.
Graphically, the sunburst is divided into the following elements:
- Rings — represent groupings and can be rearranged.
- Segments — rings are divided into segments, each segment represents a grouping value.
- Centre circle — a segment of its own, with details that can be viewed just like any other segment.
- Small circles around the sunburst — represent your workloads.
Colours of the elements on the sunburst carry particular meaning . For more information, see Sunburst Colours.
Voor meer informatie over de betekenis van ringen en segmenten, zie Sunburst in Applicatie interface
Timeburst weergave Copied
The timeburst is the central part of the screen where your is visualised. You can switch from the sunburst to the timeburst view using the View menu in the application menu bar or by right-clicking a segment in the sunburst and selecting Show timeburst view.
The timeburst provides a time dimension version to the sunburst. In the sunburst, all machines or instances are represented in the same way regardless of how long they have been running. For example, there is no difference in the representation of a machine that ran for an hour and one that ran 24/7, or when machines were active and when these were not.
In the timeburst, you can find daily patterns and visualise application behaviour. You can observe the activity levels of all your workloads based on which you can see that potential savings could be made if, for example, idle machines are switched off. For more information about potential savings and cloud optimisation options, see Recommend.
Voor meer informatie, zie Timeburst interface