Conceptos básicos
En esta sección, aprenderá sobre los conceptos básicos de Capacity Planner. Comprender estos conceptos le facilitará la lectura de esta documentación, la navegación del producto y la comunicación con sus representantes de cuenta con respecto a su configuración de Capacity Planner.
Línea base Copied
Es importante distinguir entre los siguientes términos: vista de línea base, resumen de línea base y un modelo.
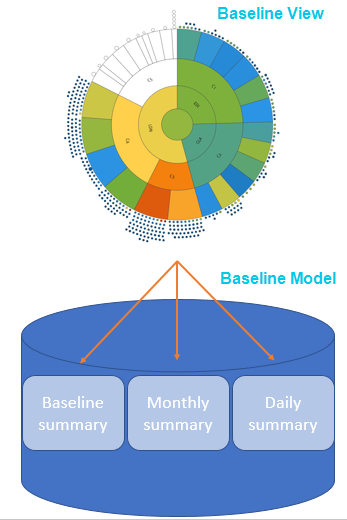
Una línea base representa un modelo de datos. Cada modelo es una colección de datos de una base de datos y tiene una fecha de inicio y una fecha de fin. Una Vista de Línea Base es una vista de demanda estadística de su infraestructura, resumiendo la utilización de recursos durante un período de tiempo. La vista predeterminada siempre está disponible y típicamente presenta un resumen de 84 días de datos. La vista también es donde puede observar las tendencias de crecimiento y el margen para el crecimiento. La visualización principal en la Vista de Línea Base se llama el sunburst. Cada elemento del sunburst representa una parte componente de su infraestructura actual.
Every project has a default baseline view that presents statistical summaries of all data in a 84 day or 12 week rolling window. Within that model there are a number of summaries. By default, there are three summaries:
- Baseline Summary — a single collection of statistical measures for every entity and metric covering the entire duration of the baseline. This is used by default.
- Monthly Summary — a collection of statistical measures for every entity and metric per calendar month that is covered by the baseline time period.
- Daily Summary — a collection of statistical measures for every entity and metric per day that is covered by the baseline time period.
La Vista de Línea Base se presenta en la interfaz utilizando la visualización del gráfico sunburst.
La Vista de Línea Base se puede configurar de muchas maneras para representar los datos de tal manera que tenga más sentido dependiendo de su infraestructura de TI. Esto se logra utilizando agrupaciones y valores de agrupación.
Cuando crea una nueva Vista de Línea Base a partir de su modelo, y selecciona un nuevo período de tiempo para esa vista, se crea un nuevo modelo. Su Vista de Línea Base se basa en ese modelo. Ese modelo tiene todos los resúmenes disponibles, pero esos resúmenes se basan en el nuevo período de tiempo. Esto se utiliza extensamente para informes mensuales. Típicamente, crearía un nuevo modelo que contenga todos los datos para el mes calendario requerido y luego usaría eso como base para informes y pronósticos. Si crea una nueva vista para registrar un mes en particular u otro período de tiempo, siempre estará disponible para usted y no cambiará ni se actualizará como resultado de obtener nuevos datos en Capacity Planner.
Si no cambia las fechas, y simplemente crea una nueva vista del modelo existente, tendrá otra Vista de Línea Base basada en el mismo modelo.
Crear vistas limitadas por tiempo de esta manera es la mejor manera de almacenar una instantánea del entorno indefinidamente.
Para más información, vea Descripción general de la Vista de Línea Base.
Puntuaciones de referencia Copied
In order to accurately model the relative differences in capability, Capacity Planner uses a concept of benchmark scores.
Each host segment in the Capacity Planner has a calculated industry standard benchmark, the SPECint rate. This benchmark data is produced by the Standard Performance Evaluation Corporation (SPEC). normalises CPU utilisation on each machine to these SPECints. This is the equivalent utilisation expressed as a function of the chipset benchmark score.
Para más información, vea Benchmarking.
Entidad Copied
El término entidad se utiliza para referirse a un objeto gestionado en Capacity Planner. Esto es típicamente un servidor físico, máquina virtual, host virtual, dispositivo de red, interfaz, archivo de disco de máquina virtual o una unidad.
El término se utiliza principalmente en informes. Para más información, vea Usando informes avanzados.
Agrupación Copied
Groupings are slices of data collected by a particular attribute. Each attribute forms a single grouping and is drawn as a ring on your . All rings are concentric, with the centre circle forming its own grouping. Groupings can represent any entity that you wish to monitor in your IT infrastructure, such as physical servers, hosts, clusters, applications, server types, tiers, VM state, and so on.
Default grouping values are automatically uploaded from your Capacity Planner chosen monitoring tool. For example, vCenter and Geneos have tags and attributes, respectively. These are automatically brought into Capacity Planner
Configuring Baseline View using grouping values provides you with the ability to view the summary data for the baseline in a number of ways depending on your business needs. For example, you can arrange the groupings in the Baseline View to view the data by application, by component, or by environment. Adding more groupings to the Baseline View creates a sophisticated view of exactly how your VMs are being tasked across your IT infrastructure to help you make more informed decisions about your business.
Para más información sobre cómo agregar, eliminar y reorganizar agrupaciones, vea Agrupaciones.
Margen de crecimiento Copied
Headroom indicates the number of reference VMs that can fit into a server or cluster before running into some capacity constraint. The headroom is based on the currently selected reference VM and host.
Para más información, vea Margen de crecimiento.
Percentil Copied
The percentile figure is the measure defining the amount of time a metric was at a particular value over the course of the baseline used in the scenario. For example, if you pick the 99th percentile for CPU right-sizing, it means that the value used for CPU is the value which the metric has spent 1% of its time at or above over the period of time of the baseline.
Host de referencia Copied
El host de referencia es el tipo de servidor más común que tiene en su entorno. Usar un host de referencia significa que las VM se dibujan en el sunburst en relación con un servidor en particular.
Para más información, vea Benchmarking.
Carga de trabajo de referencia Copied
The Baseline View lets you set a reference host or reference workload. By setting a reference you can better understand your demand profile across your IT infrastructure. The reference workload and host are used for headroom calculations. Changing your reference host or workload, rather than using a calculated average, may mean you get a more accurate view of your IT infrastructure.
Para más información, vea Carga de trabajo de referencia .
Informes Copied
Reports are a very powerful and flexible feature of . Among other features, they allow you to:
- Summarise utilisation over any time period that has been modelled for a group of entities.
- Create RAG reports indicating where any breaches may have occurred.
- Analyse relationships between metrics and check how many inactive VMs you have.
- Report on cost trends and recommendations for your cloud environment.
Most reports also provide a drill-through capability to view data at successively lower levels of granularity. They can be run against different entity types (for example, physical servers, virtual machines, or hosts). Reports have configurable parameters to provide maximum flexibility, they can be saved and shared.
Para más información, vea Usando informes avanzados.
Ajuste de tamaño correcto Copied
Forward Thinking scenario modelling helps you rationalise your IT infrastructure by automatically optimising the vCPU allocation across all workloads under a host or another segment. When you migrate workloads, you get an option to right-size servers after this migration operation is executed. We recommend that you do as this ensures that the VMs created are sized accordingly based on the capabilities of the target hardware platform.
Para más información, vea Ajuste de tamaño correcto
Vista Sunburst Copied
The sunburst is the central part of the screen where your Baseline View or Forward Thinking scenario is visualised.
Graphically, the sunburst is divided into the following elements:
- Rings — represent groupings and can be rearranged.
- Segments — rings are divided into segments, each segment represents a grouping value.
- Centre circle — a segment of its own, with details that can be viewed just like any other segment.
- Small circles around the sunburst — represent your workloads.
Colours of the elements on the sunburst carry particular meaning . For more information, see Sunburst Colours.
Para más información sobre el significado de anillos y segmentos, vea Sunburst en Interfaz de Aplicación
Vista Timeburst Copied
The timeburst is the central part of the screen where your is visualised. You can switch from the sunburst to the timeburst view using the View menu in the application menu bar or by right-clicking a segment in the sunburst and selecting Show timeburst view.
The timeburst provides a time dimension version to the sunburst. In the sunburst, all machines or instances are represented in the same way regardless of how long they have been running. For example, there is no difference in the representation of a machine that ran for an hour and one that ran 24/7, or when machines were active and when these were not.
In the timeburst, you can find daily patterns and visualise application behaviour. You can observe the activity levels of all your workloads based on which you can see that potential savings could be made if, for example, idle machines are switched off. For more information about potential savings and cloud optimisation options, see Recommend.
Para más información, vea Interfaz Timeburst