Passive Checks
What are Passive Checks? Copied
Passive Checks are designed to allow in-bound data from your applications or from other monitoring tools.
These are empty service checks. Opsview Monitor creates the service check, but we expect results to be pushed into the system from some external source.
As an aside, in a distributed environment, Opsview Cloud actually creates passive services for all Hosts that are monitored by a collector and then uses these results to update the master’s passive services.
Users can specify a passive service check to get its results from an active check. It is up to the plugin run by the active service check to return information into this particular passive service check.
For example, the Interface, Errors and Discards service checks will be defined as passive checks, where the results will be provided by the Interface Polling service check which runs the check_snmp_interfaces_cascade plugin.
If this field is set, then when a service is rechecked, the correct active service will be run.
Note
If you are integrating with external software such as NSCA (Nagios Service Check Acceptor), ensure that Results Forwarder is properly configured. Alternatively, for less frequent updates (such as several times a day), passive checks can be submitted using the REST API.
Configuring a new Passive Check Copied
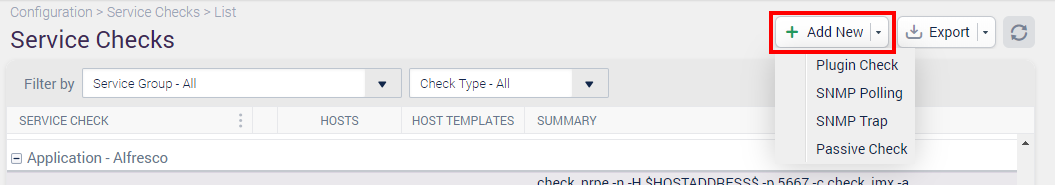
To configure a new passive check, navigate to the Configuration > Service Checks menu.
Once within the Service Checks window, click on the ‘Add New’ button in the top level and then click on ‘Passive Checks’:
The displayed window is split into two tabs:
- Details: This is where you can configure various Service Check-related fields, such as the name, description, its Service Group, its Host templates and more.
- Passive checks: The passive checks specific section; this is where the ‘Cascaded from:’ option is selected.
Details Tab: Basic Copied
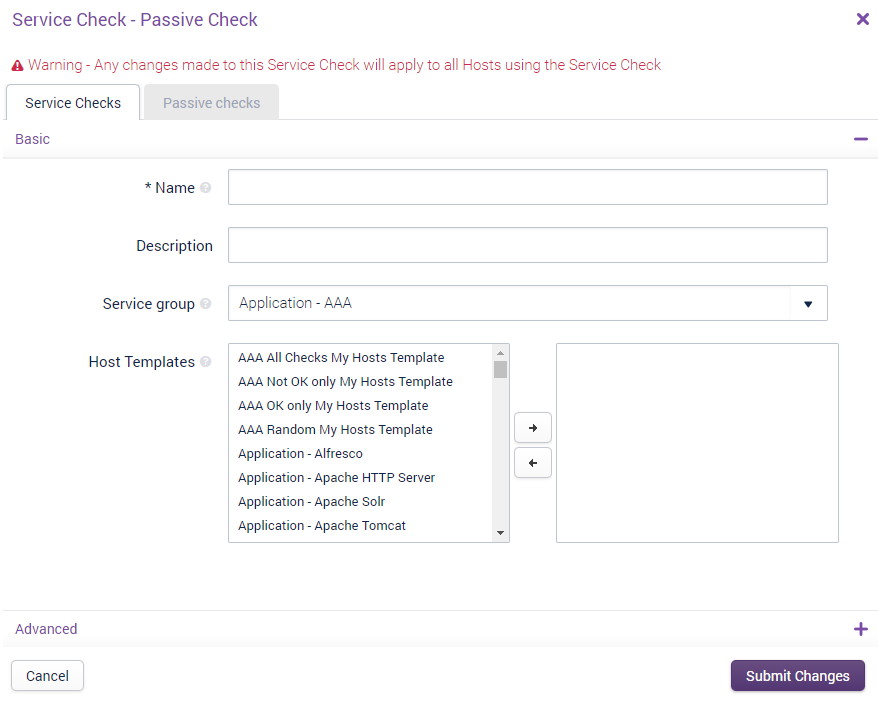
The Details tab is split into two drawers, ‘Basic’ and ‘Advanced’. The items within Basic are the most commonly used fields for Service Check configuration:
Name Copied
The name of the Service Check, i.e. ‘Cisco 3750 Stack configuration status’.
Description Copied
A friendly description of the Service Check, i.e. ‘A custom SNMP check that returns the status of the Switch in the context of its stack configuration. Apply this to all stacked Cisco 3750’s.’
Service group Copied
Covered in Section, Service Group is a container for one or more Service Checks and are used for alerting and access control, amongst others.
Host templates Copied
Covered in Section, a Host Templates can contain one or more Service Checks from any Service Group. While a Service Check can only ever belong to one Service Group, it can belong to as many Host templates as you desire.
Details Tab: Advanced Copied
The Advanced tab provides with more Service Check options:
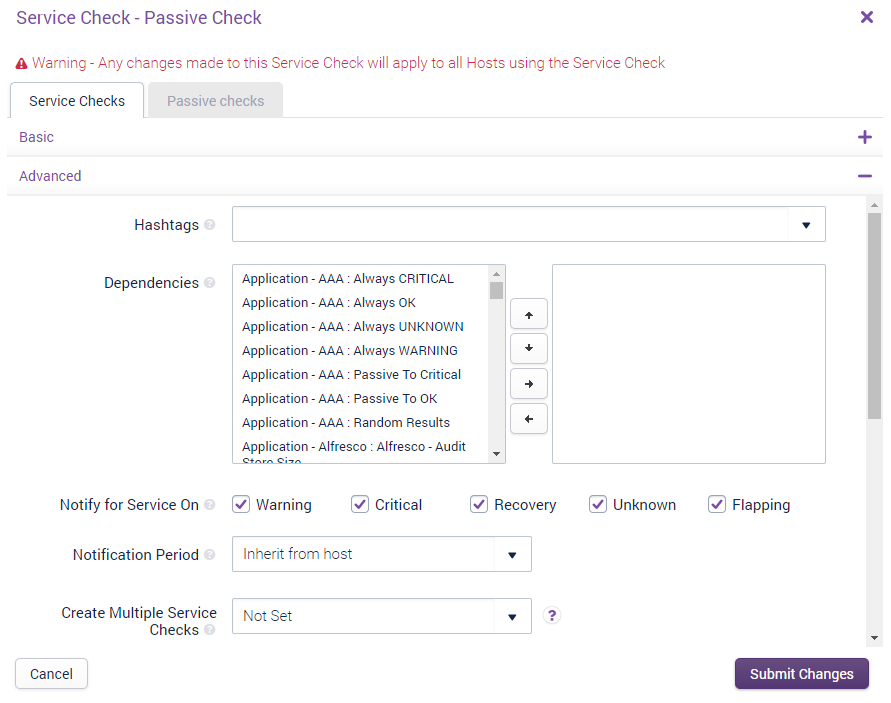
Hashtags Copied
The hashtags which this Service Check will belong to, when applied to one or more Hosts.
Globally applied hashtags Copied
If the Service Check has been added to a Hashtag via the ‘Configuration > Hashtags’ section instead of the selection box above, then the Hashtags will be listed here. To remove the Service Check from the Hashtag listed here, you should edit the Hashtag within ‘Configuration > Hashtags’.
Dependencies Copied
Dependencies allow you to set a parent/child relationship for the Service Check, i.e. for this SNMP polling check, we may choose to have a parent Service Check of ‘TCP Port 161’. This means that if the Service Check ‘TCP Port 161’ changes to a CRITICAL state (i.e. SNMP is down), then this Service Check and all other Service Checks that are a child of the aforementioned Service Check will change to an UNKNOWN state and will not resume their normal running until after the parent Service Check returns to an ‘OK’ state.
Notify for service on Copied
This section determines which states the Service Check should notify on, i.e. only on ‘CRITICAL’ or ‘UNKNOWN’, for example. **Note: **If a Host does not notify on any states, then the Service Checks on that Host will also not send any Notifications.
Notification period Copied
This field uses the ‘Time Periods’ already defined within the Opsview Cloud system, and determines when Notifications are allowed to be sent to Users.
Create Multiple Service Checks Copied
If a Variable is selected within this drop-down, for each Variable of the selected type added a new Service Check will be added with the value in the Variable added to the Service Check name. I.e. if we have ‘Disk Capacity’ as a Service Check with ‘%DISK%’ selected in the ‘Create Multiple Services: drop-down’, then if four Variables are added via the ‘Variables’ tab ’ 4 Service Checks will be added ‘Disk Capacity: Value1, Disk Capacity: Value2’, and so forth.
Flap Detection Copied
A service is considered flapping if its state changes too much. If this option is set, any services will be checked for this flapping condition and an icon will appear for the service and notifications will be temporarily disabled until the service comes out of a flapping state. We recommend that flap detection is enabled for active checks. However if you find a service is flapping frequently, there is probably another issue that needs investigating. We recommend that flap detection is disabled for passive checks.
Sensitive arguments Copied
If the Service Check is a plugin-based one, then the Sensitive Arguments checkbox allow you to determine if the arguments for the service check are displayed within the ‘Test Service Check’ tab within the investigate mode. If the flag is checked, the arguments will be hidden, if unchecked the arguments will be shown. If you have TESTCHANGE set within your Role, you will be able to modify the arguments before testing the Service Check.
Record Output Changes Copied
Normally, the output of a Service Check is only recorded when the state of that service changes. For example, assuming a new check has been set up:
| State | Output | Output Recorded |
|---|---|---|
| OK | Service OK: 10% | Yes |
| OK | Service OK: 15% | No |
| OK | Service OK: 15% | No |
| OK | Service OK: 20% | No |
| CRITICAL | Service warning: 80% | Yes |
| CRITICAL | Service warning: 75% | No |
| WARNING | Service warning: 70% | Yes |
| WARNING | Service warning: 40% | No |
| WARNING | Service warning: 40% | No |
| OK | Service OK: 20% | Yes |
| OK | Service OK: 18% | No |
This option instead causes every change of output to be logged regardless of change of state (for the selected state changes). For example, for the same sequence above with OK and WARNING selected:
| State | Output | Output Recorded |
|---|---|---|
| OK | Service OK: 10% | Yes |
| OK | Service OK: 15% | Yes |
| OK | Service OK: 15% | No |
| OK | Service OK: 20% | Yes |
| CRITICAL | Service warning: 80% | Yes |
| CRITICAL | Service warning: 75% | NO - CRITICAL option was not selected |
| WARNING | Service warning: 70% | Yes |
| WARNING | Service warning: 40% | Yes |
| WARNING | Service warning: 40% | No |
| OK | Service OK: 20% | Yes |
| OK | Service OK: 18% | Yes |
Alert every failure Copied
This option forces a Notification to be sent on every check in a non-OK state. This is useful if you have a passive Service Check which receives results. There are three states for this option:
- Disabled: only get alerts on state changes.
- Enabled: get alerts for every failed state. This overrides the re-notification interval option.
- Enabled with re-notification interval: get alerts for every failed state as long as the re-notification interval has passed. This is useful if you get a lot of results in quick succession.
Note
The Notification number will increase for every non-OK result and only gets reset to zero when an OK state is received.
Event handler Copied
Covered in greater detail in the ‘Event handler’ section of the User Guide, Event Handlers are scripts that can be triggered when a Service Check goes into or recovers from a problem state, such as ‘WARNING’ or ‘CRITICAL’. The script can do anything you like, but a common usage includes restarting a service or server (virtual machine, for example) via an API.
Check Freshness Copied
If you are receiving passive results, you may want to check that you are getting results within a certain timeframe. From Opsview Cloud 6.0.0, you can configure this to take an action. You can enable freshness checking which means that if this service has not been updated for this amount of time, then an artificial result can be inserted into the system. Freshness checking will only occur within the Time Period on the host that this service check belongs to.
Timeout Copied
This is the amount of time before Opsview Cloud considers a service to be not fresh. You can enter this value in a duration format, such as 10m for 10 minutes or 48h 15m for 48 hours and 15 minutes.
Status Copied
Choose the appropriate state that you want the service to change to when it passes the freshness threshold. You may want to automatically set a service back to OK after one hour for certain types of checks.**
Text Copied
Choose what text you want to set as the output. The text will be added to the end of the state phrase (OK, WARNING, CRITICAL, UNKNOWN).
Passive Checks Tab Copied
Once you have configured the relevant options within the ‘Details’ tab, you can click on the ‘Passive Checks’: tab:
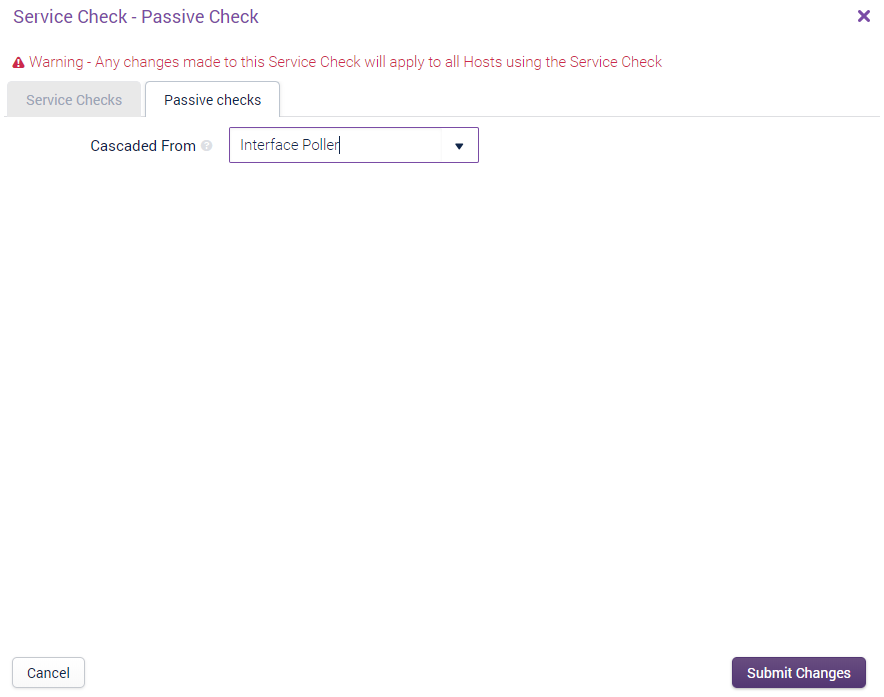
This window contains just one option:
Cascaded From Copied
Designates an active check that is responsible for submitting passive results into your new passive Service Check. This ensures that when a recheck is performed, the correct active check runs for your passive check.
- For example, the Interface, Errors and Discards Service Checks will be defined as passive checks, where the results will be provided by the Interface Polling Service Check which runs the check_snmp_interfaces_cascade plugin.
- If this field is set, then when a service is rechecked, the correct active service will be run.
Once the passive check and its options have been configured, it can be applied to one or more Hosts. See ‘Section Service Checks Tab’ for guides on how to add the newly created Service Check to a Host.
Submitting Results to Passive Checks Copied
Results for passive checks can be submitted in one of two ways:
- Using the REST API
- Writing to
results.sockon a collector