Flow Collector Dashlets
Analyzing the data Copied
Once Flow Collector(s) and Flow Sources are set up, you can start analyzing the received data. Analysis of Flow data is done via Monitoring > Dashboards, using one or more of the available Flow Collectors dashlets:
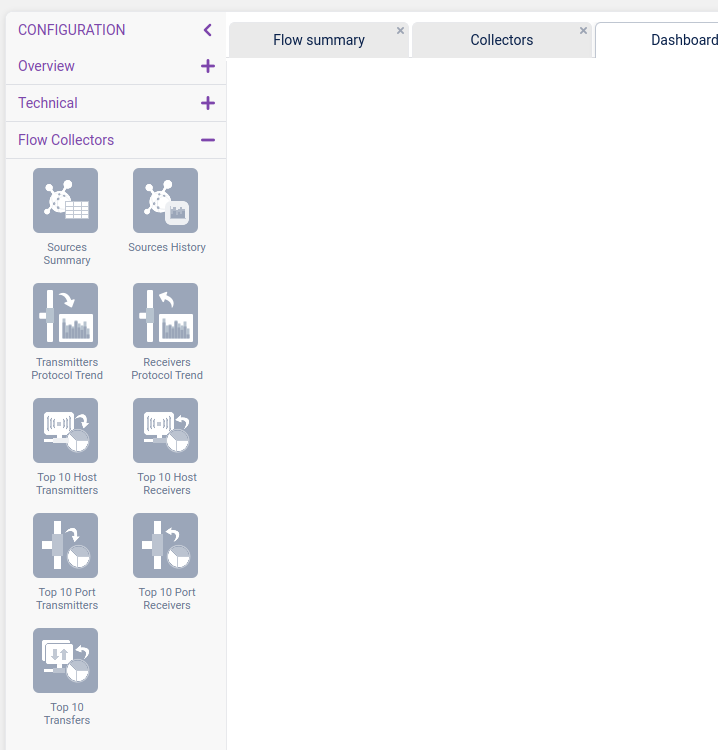
The following Dashlets are available:
- Sources Summary
- Sources History
- Top 10 Host Transmitters
- Top 10 Host Receivers
- Top 10 Port Transmitters
- Top 10 Port Receivers
- Top 10 Transfers
- Transmitters Protocol Trend
- Receivers Protocol Trend
In the following sections we will cover each of the Dashlets, covering how to configure the Dashlet and what data is returned.
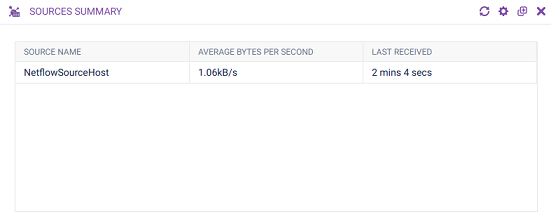
Sources Summary Copied
This dashlet lists all the configured Flow Sources and the average amount of data received from them as well as the last update time.
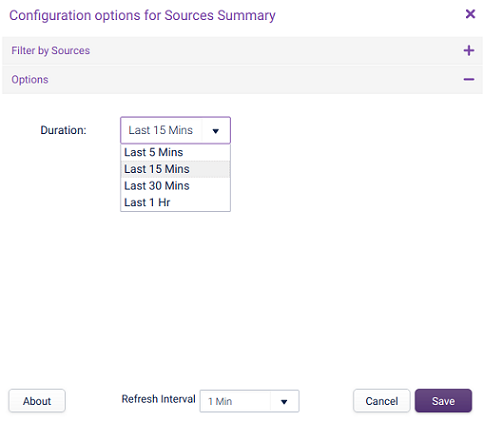
Click on the cog icon to configure the dashlet options:
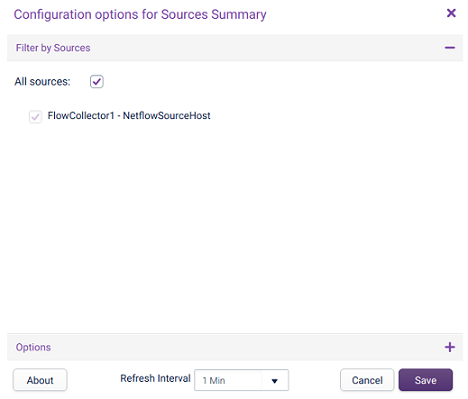
In the above configuration window, you can choose which sources are displayed within the Sources Summary Dashlet (either individually select the sources, or select All sources to display all sources within the Opsview Cloud system).
There is also a ‘Duration’ field within the Options section which allows you to determine the ‘average bytes’ period, this can be seen below:
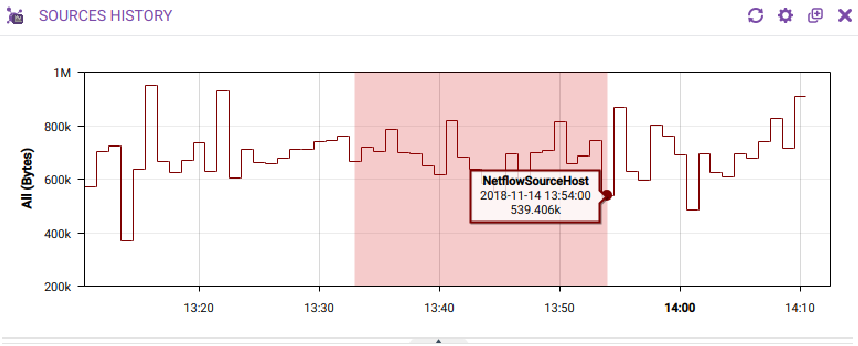
Sources History Copied
This dashlet displays the data transferred through each Flow Source, and investigate specific points in time. To investigate a time, i.e. perhaps a spike in the throughput, hover your mouse over the time period which will display a tooltip with IP, Date and, Time which can be clicked to open the investigate window, as below:
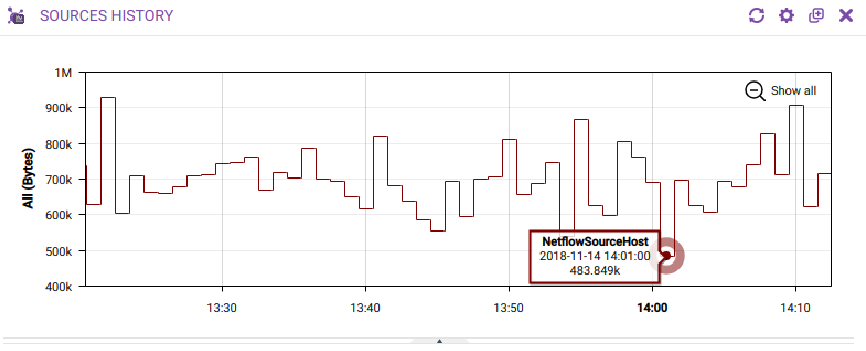
When the beacon spot is clicked, a modal investigation window will load. This investigate window will display the data as it was at the point in time selected, i.e. it will display the ‘top 10 transfers’ that were occurring at the selected time.
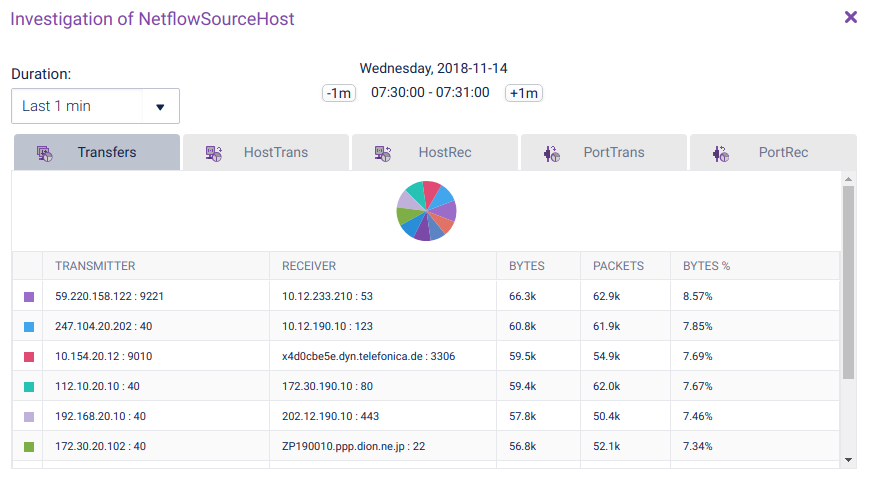
You can also choose to change the duration from one of the following options. These buttons, along with the ‘-1’ and ‘+1’ buttons, allow you to step through the period in time – i.e. ‘What does it look like 10 minutes from now?’. This is great troubleshooting tool, as you can step through minute by minute to see what was happening on the network, and at which specific time it began to get overloaded (for example).
The configuration for the ‘Sources History’ Dashlet contains two sections: ‘Filter by Sources’ and ‘Graph Settings’, as below:
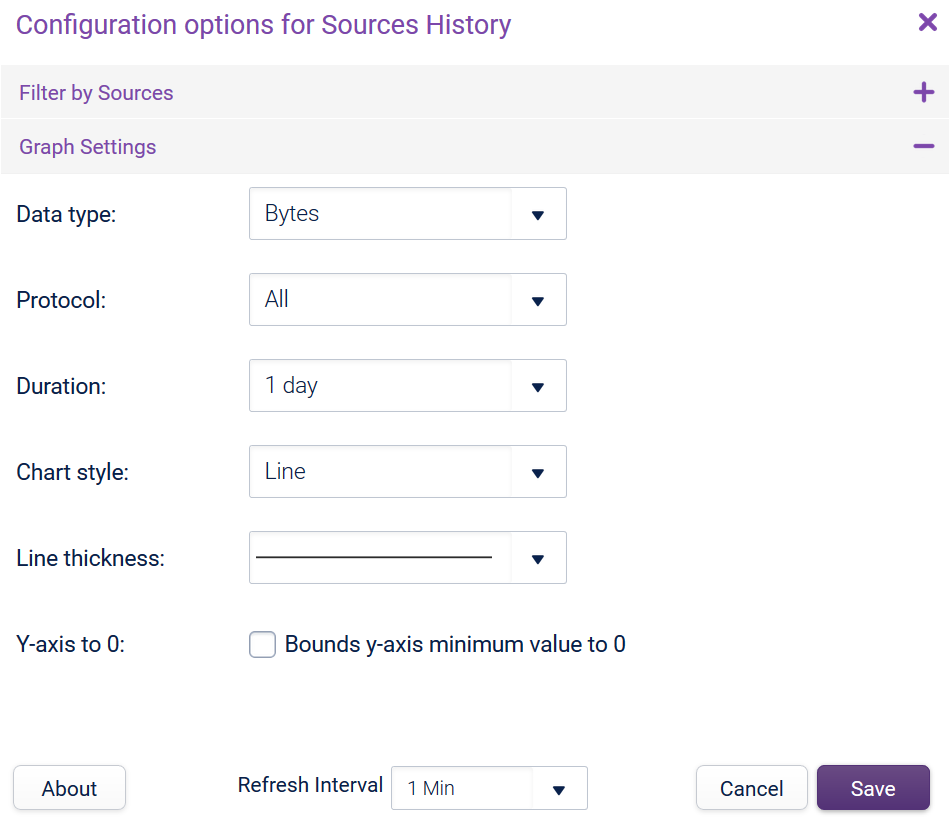
The ‘Filter by Sources’ section, allows you to choose which Flow Sources are displayed on the dashlet. The ‘Graph Settings’ section allows you to fine tune how the graph is displayed:
- Data type: Bytes, Packets or Flows.
- Protocol: All, UDP, TCP, ICMP, Other.
- Duration: 1 hour, 3 hours, 6 hours, 12 hours, 1 day, 2 days, 3 days, 5 days, 10 days, 30 days.
- Chart style: Line, Area, Stack.
- Line thickness: Various options.
There is also the option to bind the ‘Y-Axis to 0’.
Finally, you can choose to ‘zoom’ into a specific section of the Sources History Dashlet by left-clicking and dragging your mouse over a specific area, which will redraw the Dashlet to focus just on the selected time period, as below:
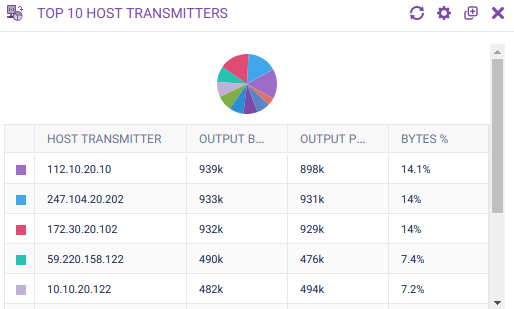
Top 10 Host Transmitters Copied
This dashlet displays the ‘Top 10 Talkers’ in terms of Bytes and packets transmitted per host, on a collector basis.
Click on the cog icon to configure the dashlet options:
![]()
You must choose a Flow Collector first.
After choosing the Flow Collector, the Flow Sources list will populate with all the Flow Sources created on the chosen Flow Collector. You can then choose to use data from all Flow Sources, or select Flow Sources one by one.
The ‘Options’ section allows you to define the ‘Duration’:
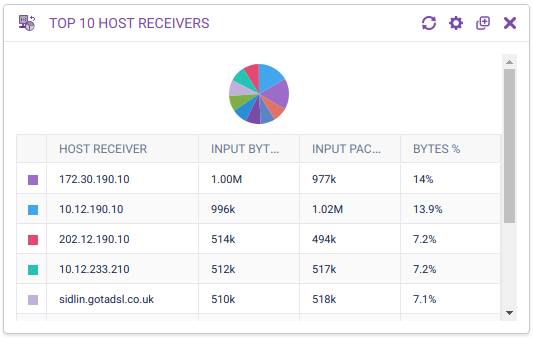
Top 10 Host Receivers Copied
This dashlet displays the ‘Top 10 Downloaders’ in terms of Bytes and packets received per host, on a collector basis.
Click on the cog icon to configure the dashlet options:
![]()
You must choose a Flow Collector first. After choosing the Flow Collector, the Flow Sources list will populate with all the Flow Sources created on the chosen Flow Collector. You can then choose to use data from all Flow Sources, or select Flow Sources one by one.
The ‘Options’ section allows you to define the ‘Duration:’, i.e. the time period the data is gathered over. Options include ‘Last 1 Min’, ‘Last 2 Mins’, ‘Last 5 Mins’ and ‘Last 10 Mins’.
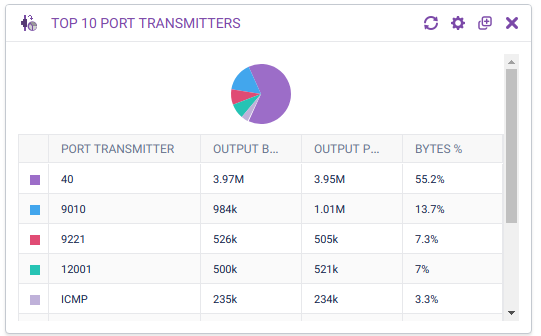
Top 10 Port Transmitters Copied
This dashlet displays the ‘Top 10 Ports’ in terms of Bytes and packets transmitted (i.e. data is being sent from Port 123), on a collector basis:
Click on the cog icon to configure the dashlet options:
![]()
You must choose a Flow Collector first. After choosing the Flow Collector, the Flow Sources list will populate with all the Flow Sources created on the chosen Flow Collector. You can then choose to use data from all Flow Sources, or select Flow Sources one by one.
Finally, the Options section allows you to define the ‘Duration’.
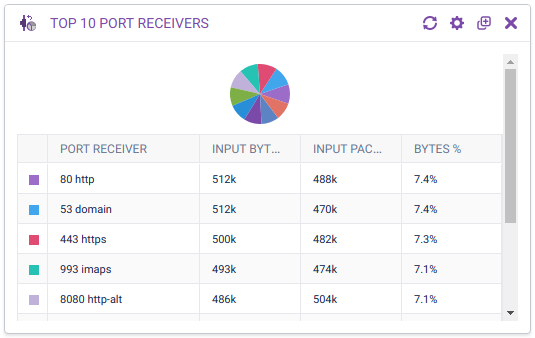
Top 10 Port Receivers Copied
This dashlet will display the ‘Top 10 Ports’ in terms of Bytes and packets downloaded/recieved (i.e. data is being downloaded to Port 123), on a collector basis:
Click on the cog icon to configure the dashlet options:
![]()
You must choose a Flow Collector first, i.e. an Opsview Cloud master or a cluster server. After choosing the Flow Collector, the Flow Sources list will populate with all the Flow Sources created on the chosen Flow Collector. You can then choose to use data from all Flow Sources, or select Flow Sources one by one.
Finally, the Options section allows you to define the ‘Duration’.
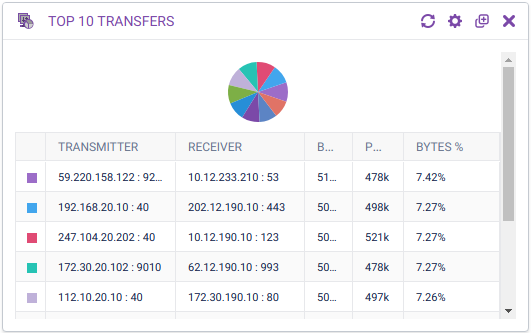
Top 10 Transfers Copied
This dashlet will display the Top 10 transfers on a collector basis, including the transmitter (Host + port) and Reciever (Host + Port), along with the Bytes, Packets, and the % of the total Bytes transferred (allowing you to see if a single transfer is eating all of your bandwidth).
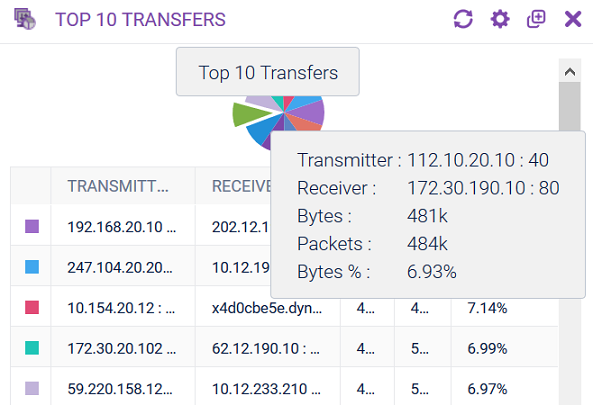
To view the transmitter port (as it is cut off in the Dashlet below), simply mouse over on the pie chart segment:
Click on the cog icon to configure the dashlet options:
![]()
You must choose a Flow Collector first, i.e. an Opsview Cloud master or a cluster server. After choosing the Flow Collector, the Flow Sources list will populate with all the Flow Sources created on the chosen Flow Collector. You can then choose to use data from all Flow Sources, or select Flow Sources one by one.
Finally, the Options section allows you to define the ‘Duration’.
Protocol Trend Dashlets Copied
These dashlets are used to display the top ports and protocols used to receive or transmit data, as recorded by the source device (such as a switch or firewall) that supports netflow/sflow.
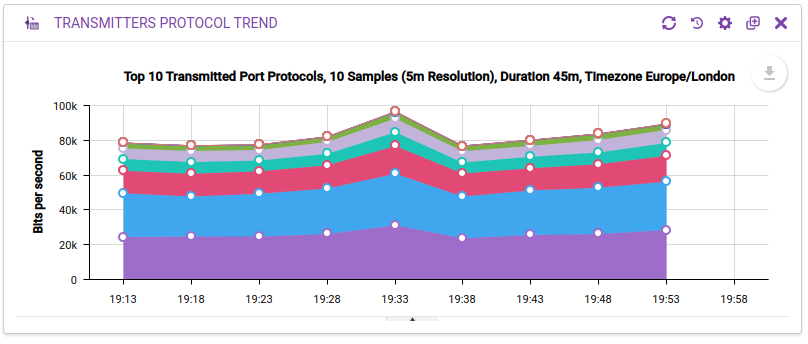
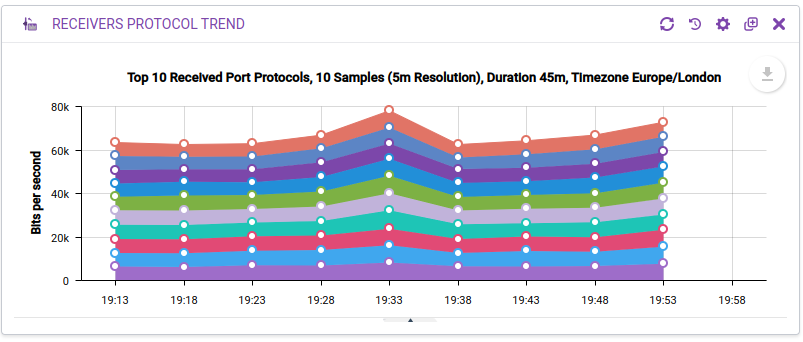
The dashlets will list the busiest port/protocol pairs (10, by default) over the chosen time range (e.g: 1 hour), in terms of bits per second (bps), showing the data trend over a number of samples (e.g: data points every 5 minutes) to provide a stacked graph representation.
How is this calculated?
Data points on the graph for each port/protocol pair will report the average bps over the whole of the following sample, sized according to the graph resolution - for example, with a 2m resolution graph, with data points at 14:09 and then 14:11, the data point at 14:09 will report the average bps over the 14:09-14:11 period, while the data point at 14:11 will report the average bps over the 14:11-14:13 period. The bps values are calculated based on the total bits (bytes * 8) reported by the netflow/sflow data in the sample, divided by the sample resolution size.
If there are small gaps in the data for a minute/set of minutes (due to a system issue or Flow Collector failure, for example, or if the system has just started or stopped monitoring the source) then the average over a larger resolution may appear lower. Zooming into 1 minute resolution will display all such gaps in the graph in the correct position for troubleshooting.
Warning
Refreshing the whole dashlet or viewing historical data is a resource intensive operation and may take over a minute to complete if reporting on large volumes of data over multiple hours. Load times will increase if multiple dashlets are configured querying the same Flow Collectors, and/or if dashboards are shared and multiple users are viewing at the same time.
The legend will list these port/protocol pairs, with a service name if available.
Note
In order to accurately label port/protocol pairs with the correct service, ensure that the/etc/servicesfile on all your Opsview Flow Collectors matches those on the rest of network. Add additional entries in/etc/serviceson all of your Opsview Flow Collectors to add new custom labels to matching port/protocol pairs in your netflow/sflow data.
You can zoom in on the dashlet by drag-selecting a range within the cursor - this will give a more granular sample time (e.g: 3 minutes) for the current list of port/protocol pairs. If you use the Time Range Picker icon in the top right corner, you can only select a duration less than the maximum duration (3 hours) and the full list of ports will be re-calculated based on the new selected time range.
If you use the Time Range Sync feature, all Protocol Trend graphs (Receivers and Transmitters) will synchronize time ranges and cursors with each other. They will not be synchronized with Performance Graph dashlets.
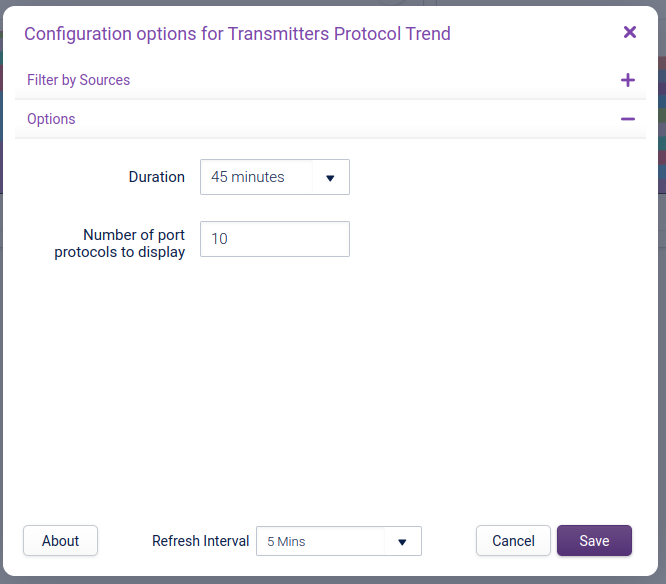
Click on the cog icon to configure the dashlet options:
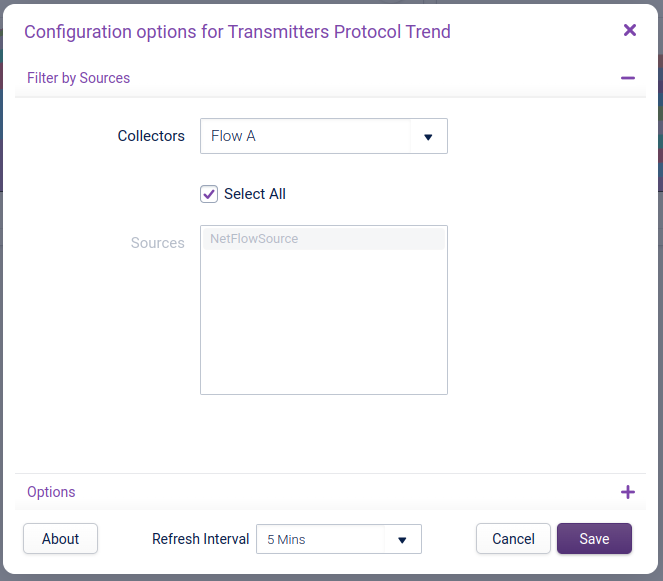
You must choose a Flow Collector first. After choosing the Flow Collector, the Flow Sources list will populate with all the Flow Sources created on the chosen Flow Collector. You can then choose to use data from all Flow Sources, or select Flow Sources one by one.
The ‘Options’ section allows you to define the ‘Duration’ of the data displayed in the graph, as well as the number of port protocols to display: