Advanced analytics, forecasting, and data storage through the Obcerv component

Geneos now includes data storage and analytics capabilities that provide intelligence to deliver end-to-end observability across an enterprise. Alongside the Gateways, Obcerv is now a core part of Geneos.

With Obcerv apps, you can enjoy better anomaly detection, noise reduction for large-scale monitoring, and deeper root cause analysis through a user-friendly, web-based interface.

The connection with Gateways, for example, allows running commands directly on entities and metrics within the Obcerv Entity Viewer app, ensuring seamless access and instant history.

Dynamic Thresholds alerts

Unlike a static threshold, a dynamic threshold alert compares the current value of a metric against what Geneos has determined to be the normal value at a specific point in time. Dynamic thresholds can adapt to daily or weekly trends, providing a better representation of a system's health. This can improve operational efficiency, minimize false alerts, and reduce alert noise.

Dynamic threshold alerts are created in the Gateway based on seasonal time series data from Obcerv.

Comprehensive insight into Google Cloud Platform services

With the increasing adoption of multi-cloud deployment strategies, many companies have chosen the Google Cloud Platform (GCP) as their preferred solution.

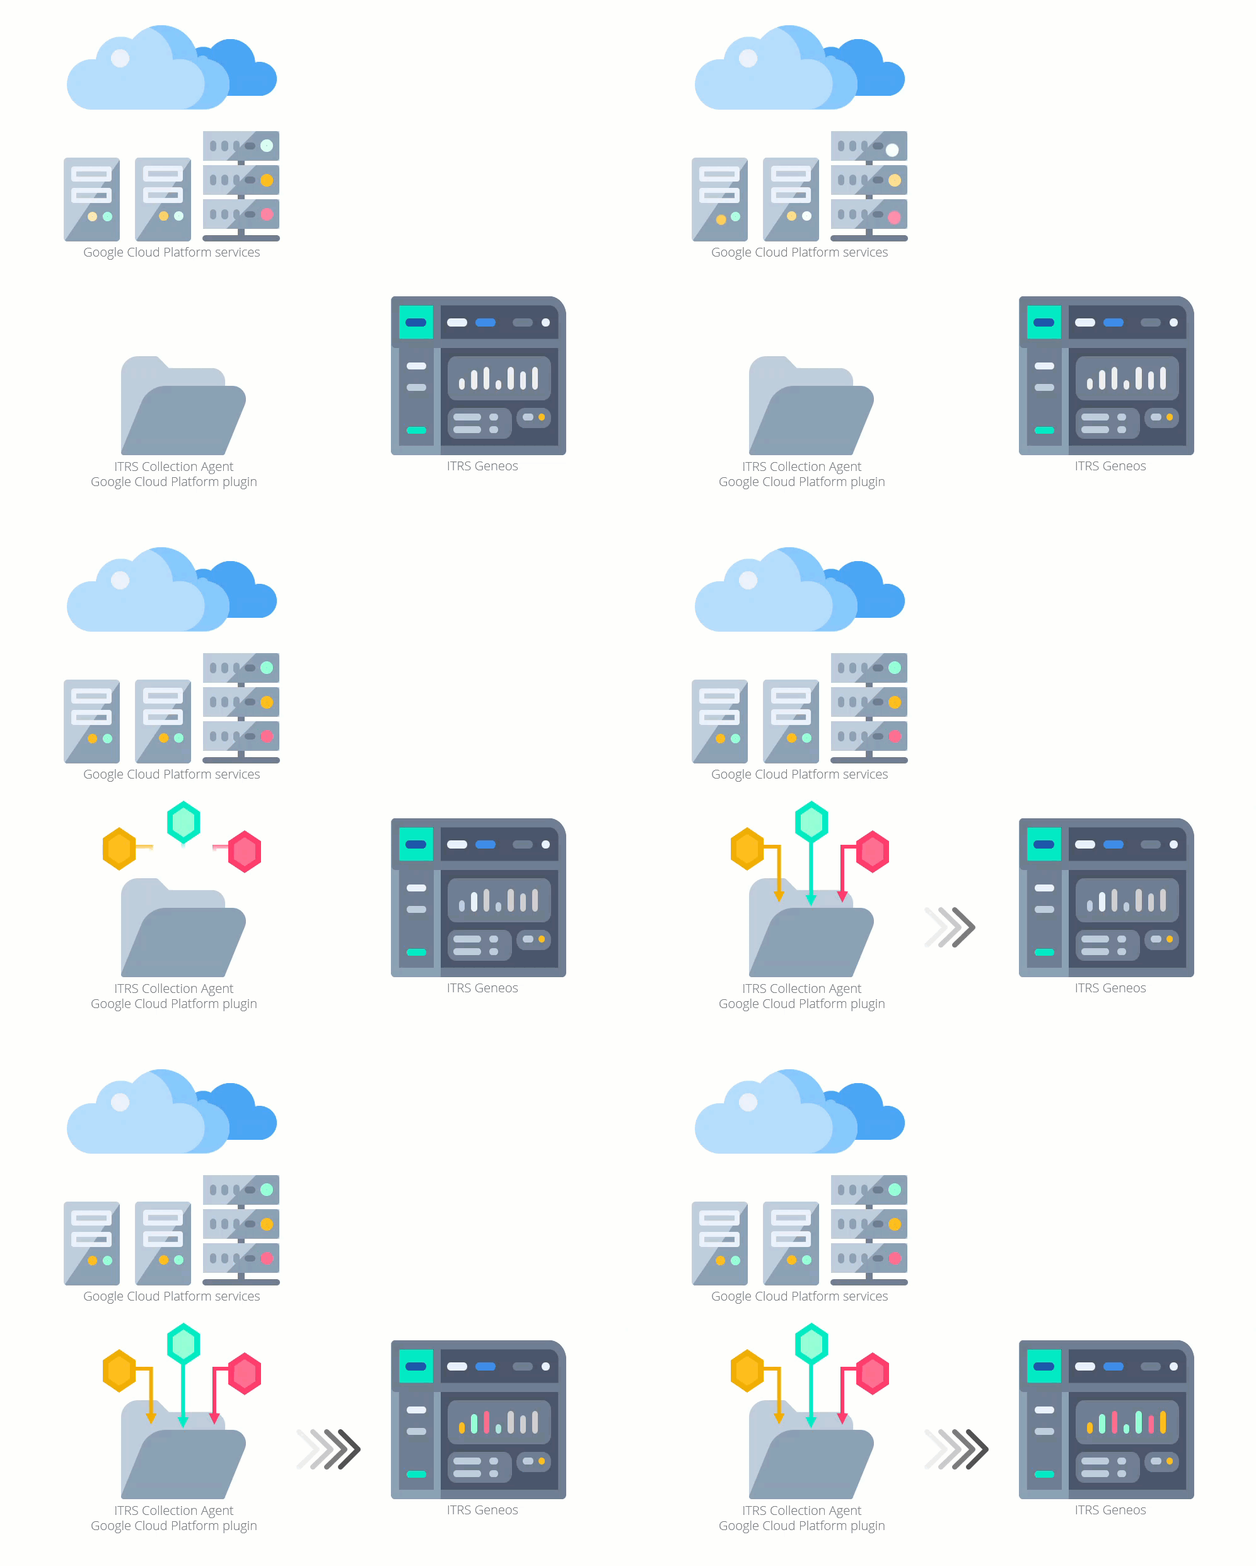
The new Collection Agent plugin for the Google Cloud Platform provides you with an end-to-end visibility into your hybrid and multi-cloud environments. The plugin can monitor more than 15 services, including cloud functions, networking, databases, and more.

Collect and monitor database data with JDBC plugin

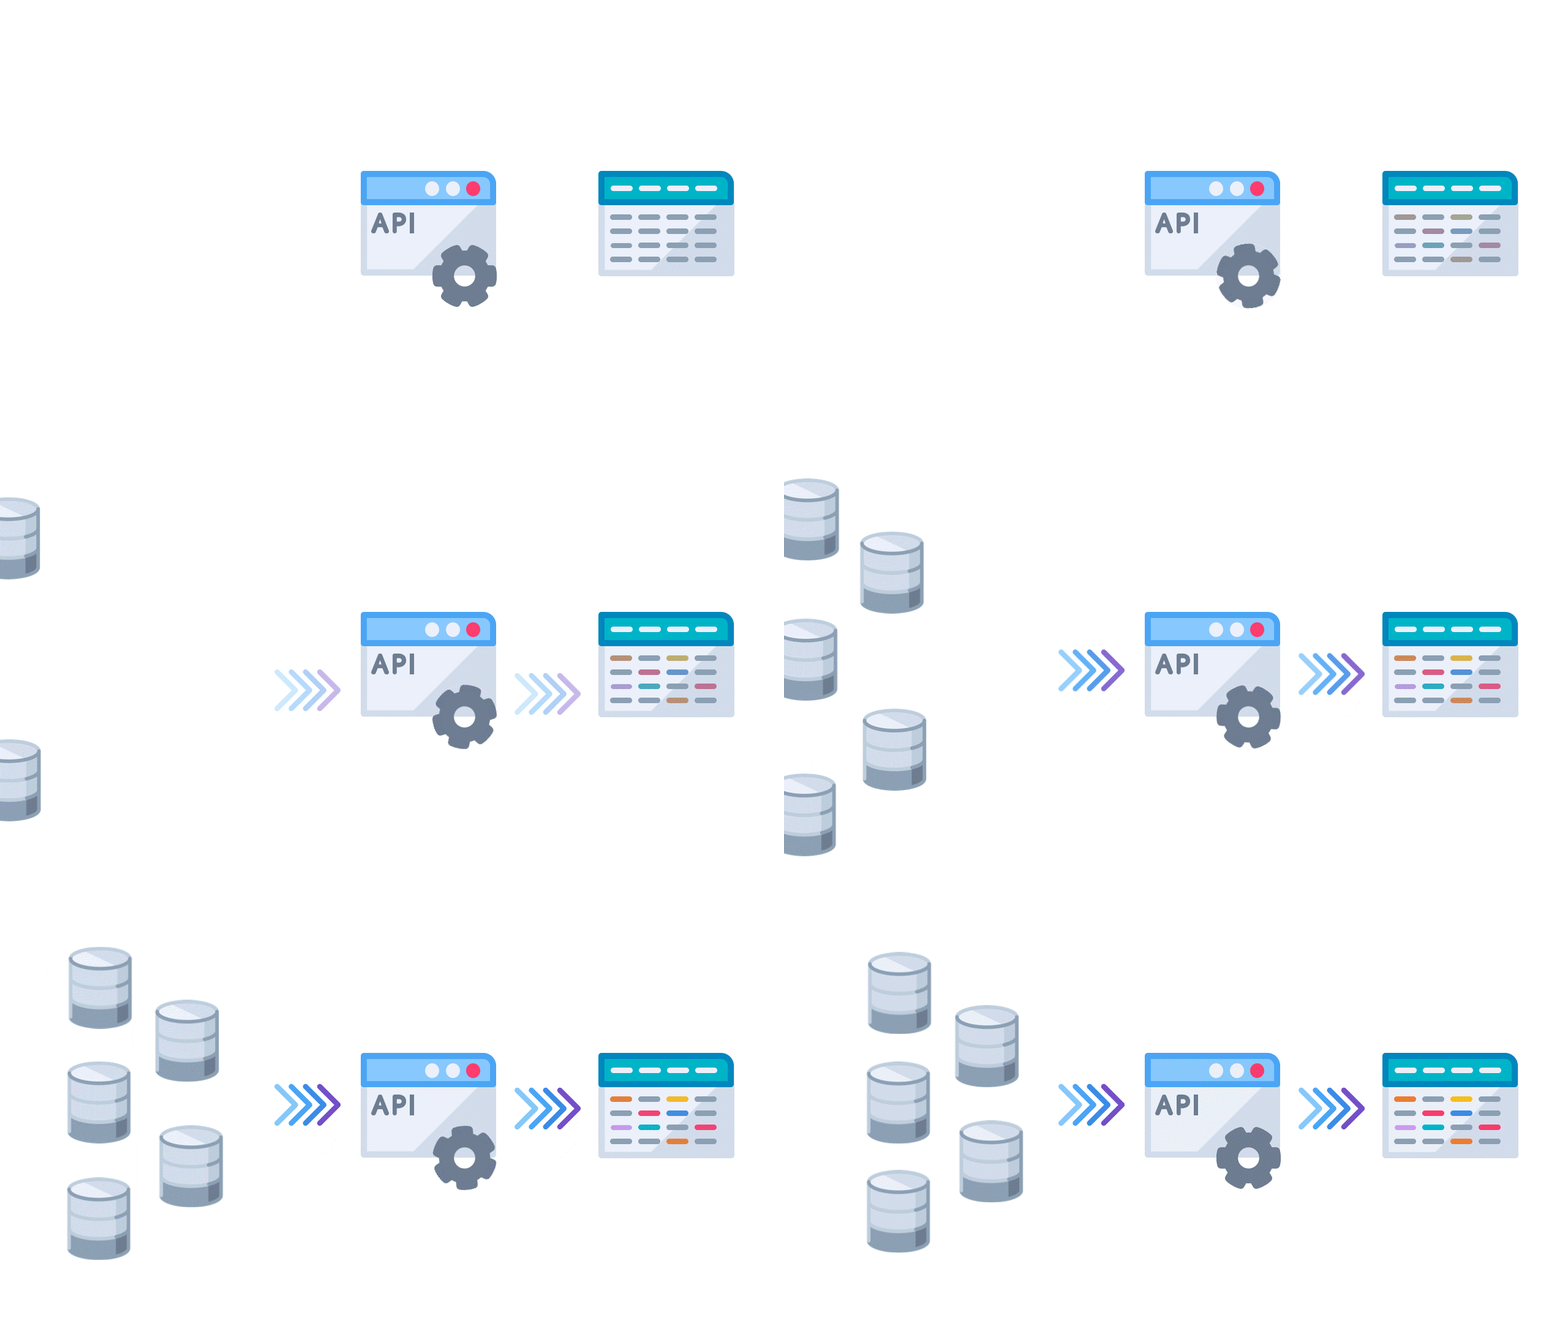
ITRS has introduced a new Collection Agent plugin called the JDBC plugin, which allows you to seamlessly collect and monitor database data through SQL queries executed via the JDBC API.

The JDBC plugin offers out-of-the-box compatibility with several databases, including MariaDB, Microsoft SQL Server, PostgreSQL, and Oracle. This broad range of compatibility ensures that you can easily connect to your preferred database and start collecting data.

Collect OpenTelemetry data for complete observability

OpenTelemetry is an open, vendor-neutral standard adopted and supported by industry leaders in the observability space. With the increased use of highly distributed microservice architectures, OpenTelemetry has become the standard for instrumenting applications for collecting observability data.

ITRS is excited to introduce the new OpenTelemetry plugin supporting the OpenTelemetry Protocol (OTLP) for collecting metrics, logs, and traces (partially supported). This plugin gives you full-stack monitoring of your systems and applications, alongside your other monitoring using the extensive range of plugins in Geneos.

Geneos and Obcerv connectivity

Take your performance monitoring to the next level with scalable architecture and data storage. Geneos real-time monitoring with ITRS Obcerv allows you to store, collate, contextualise, and visualise your data, giving you end to end visibility for operational resilience.

The Gateway and Netprobe can publish all your metrics and logs, respectively, to Obcerv for centralisation in a single platform. Additionally, Active Console users can build history charts by querying the data stored in Obcerv.

Easy access to Geneos data

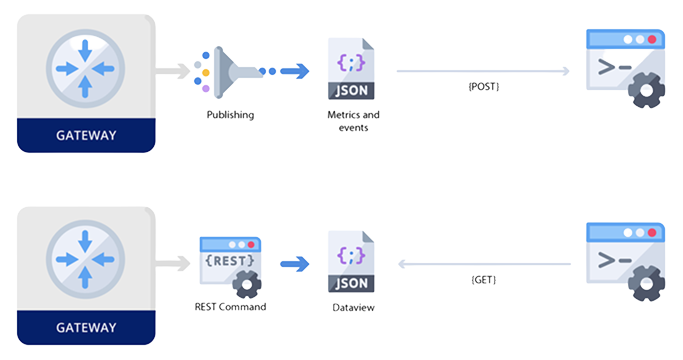
There are two new ways to access the real-time data in Geneos Gateways, in addition to the already supported publishing method to Kafka and the new ITRS Obcerv platform. Gateways can now publish data to an HTTP/HTTPS endpoint, and REST services now support a new endpoint to request a snapshot of a dataview.

Amazon Web Services (AWS)

Monitor your AWS resources in a single enterprise platform alongside your on-premise and hybrid environments. The Geneos AWS plugin now supports over 20 AWS services, such as EC2, EBS, RDS, ECS, Network Firewall, Kinesis, Lambda, SNS, VPN, Load Balancers, DynamoDB, and many more.

Additionally, the AWS plugin collects AWS CloudWatch metrics, logs, and events to provide unified information across your AWS resources. This improves Geneos cloud monitoring capabilities by building a more easy-to-use and scalable solution to interface with AWS CloudWatch when monitoring various services being deployed in AWS.

Microsoft Azure Monitor

Monitor the health of your Azure cloud resources alongside your on-premise, multi-cloud, and hybrid environments all in one enterprise tool.

The Geneos Azure Monitor plugin supports the ability to consume real-time metrics from the Azure Event Hub service or by polling the Azure Monitor API, enabling Geneos to monitor your Azure cloud environment at scale and in real-time. Built-in mappings for the Azure Monitor plugin also allow Geneos to dynamically create entities and dataviews to keep configuration to a minimum.

Prometheus and Alert Manager

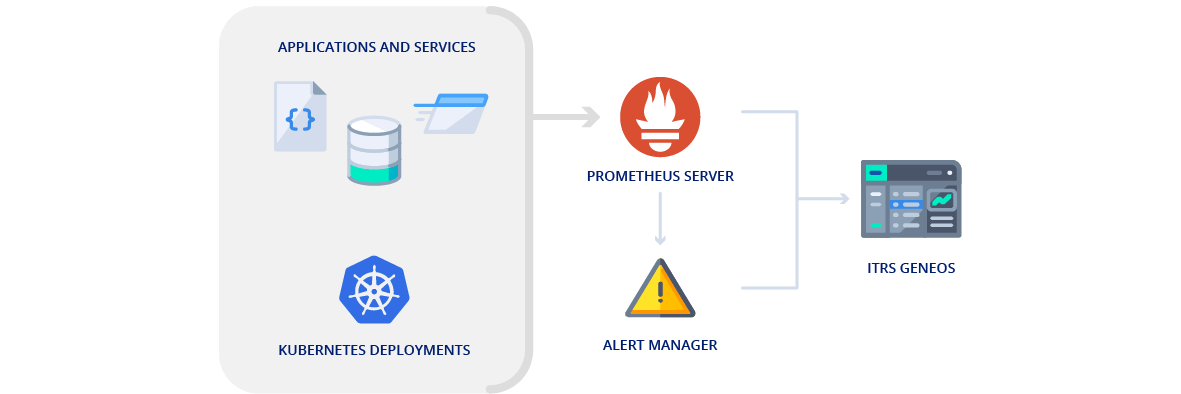
Prometheus has become a widely adopted standard in application monitoring, especially in orchestrated environments. If Prometheus is your choice of tool, the Geneos plugin for Prometheus and Alert Manager lets you bring your metrics and Alert Manager events into Geneos for a unified view across your entire stack.

Geneos for monitoring dynamic environments

Monitoring dynamic and orchestrated environments require Geneos to be more dynamic. From on-demand and elastic server availability in cloud to containers or microservices, and orchestrators, such as Kubernetes and OpenShift, Geneos provides the tools you need to monitor containers, microservices, serverless applications, and other virtual environments.

This release introduces a number of new features to make configurations easier and automate monitoring, and this greatly reduce the configuration burden and automate monitoring by dynamically creating and organising Geneos data structures like entities and attributes.

Netprobe to Elasticsearch

File Keyword Monitor (FKM) plugin collects vast amount of log data, generating metrics for monitoring key events, and discarding the row log data. With a simple configuration, you can now publish log data you are already collecting into Elasticsearch and Splunk

The data published is enriched with Geneos context so that you can search by managed entity, severity, and any matching, or ignored key words. Integrated workflow lets you go from a dataview in Geneos to log search across all your hosts with few simple clicks.

Integrated multi-product landscape

The always-on IT environments of today require multiple products to deliver the single pane of glass view of the increasingly complex technology landscape. Geneos can integrate with other ITRS suites of products to deliver the best possible solution.

  • Capacity Planner application can identify hot and cold spots in your hybrid estate to optimise cost and performance. The integration allows capacity data already collected by Geneos to be sent to Capacity Planner with minimal configuration.
  • OP5 Monitor product is a comprehensive monitoring and alerting tool for your IT networks and infrastructures at scale. The Geneos OP5 Monitor plugin allows you to visualise the OP5 Monitor host and service level status in Geneos alongside your application monitoring.
  • Uptrends product is an end-user experience monitoring solution that can synthetically monitor your websites, APIs, and web applications. The Geneos Uptrends plugin enables you to build end-to-end visibility of your estate by having the “outside-in” client view alongside your application monitoring.

Ready to see the latest Geneos version in action?

UPGRADE NOW
["Geneos"] ["Release Notes", "What's New"]