Grundläggande begrepp
I det här avsnittet kommer du att lära dig om grundläggande begrepp för Capacity Planner. Att förstå dessa begrepp kommer att göra det lättare för dig att läsa denna dokumentation, navigera i produkten och kommunicera med dina kontorepresentanter angående din Capacity Planner-inställning.
Baslinje Copied
Det är viktigt att skilja mellan följande termer: baslinjevy, baslinjesammanfattning och en modell.
En baslinje representerar en datamodell. Varje modell är en samling data från en databas och den har ett startdatum och ett slutdatum. En Baslinjevy är en statistisk efterfrågevy av din infrastruktur, som summerar resursanvändning över en period. Standardvyn är alltid tillgänglig och presenterar vanligtvis en sammanfattning av 84 dagars data. Vyn är också där du kan titta på tillväxttrender och utrymme för tillväxt. Den primära visualiseringen i Baslinjevyn kallas solfjäder. Varje element i solfjädern representerar en komponentdel av din nuvarande infrastruktur.
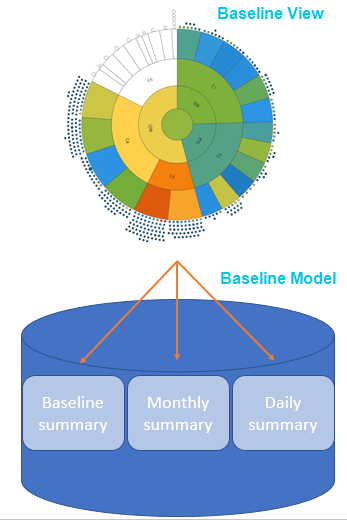
Every project has a default baseline view that presents statistical summaries of all data in a 84 day or 12 week rolling window. Within that model there are a number of summaries. By default, there are three summaries:
- Baseline Summary — a single collection of statistical measures for every entity and metric covering the entire duration of the baseline. This is used by default.
- Monthly Summary — a collection of statistical measures for every entity and metric per calendar month that is covered by the baseline time period.
- Daily Summary — a collection of statistical measures for every entity and metric per day that is covered by the baseline time period.
Baslinjevyn presenteras i gränssnittet med hjälp av visualiseringen av solfjäderdiagrammet.
Baslinjevy kan konfigureras på många sätt för att representera data på ett sätt som är mest meningsfullt beroende på din IT-infrastruktur. Detta uppnås med hjälp av grupperingar och grupperingsvärden.
När du skapar en ny Baslinjevy från din modell och väljer en ny tidsperiod för den vyn, skapas en ny modell. Din Baslinjevy baseras på den modellen. Den modellen har alla sammanfattningar tillgängliga, men de sammanfattningarna baseras på den nya tidsperioden. Detta används omfattande för månatlig rapportering. Typiskt skulle du skapa en ny modell som innehåller alla data för den krävda kalendermånaden och sedan använda det som grund för rapportering och prognoser. Om du skapar en ny vy för att registrera en viss månad eller annan tidsperiod, kommer den alltid att vara tillgänglig för dig och den kommer inte att ändras eller uppdateras som ett resultat av att få nya data i Capacity Planner.
Om du inte ändrar datumen och helt enkelt skapar en ny vy av den befintliga modellen kommer du att ha en annan Baslinjevy baserad på samma modell.
Att skapa tidsbegränsade vyer på detta sätt är det bästa sättet att lagra en ögonblicksbild av miljön på obestämd tid.
För mer information, se Översikt över Baslinjevy.
Benchmarkpoäng Copied
In order to accurately model the relative differences in capability, Capacity Planner uses a concept of benchmark scores.
Each host segment in the Capacity Planner has a calculated industry standard benchmark, the SPECint rate. This benchmark data is produced by the Standard Performance Evaluation Corporation (SPEC). normalises CPU utilisation on each machine to these SPECints. This is the equivalent utilisation expressed as a function of the chipset benchmark score.
För mer information, se Benchmarking.
Entitet Copied
Termen entitet används för att hänvisa till ett hanterat objekt i Capacity Planner. Detta är typiskt en fysisk server, virtuell maskin, virtuell värd, nätverksenhet, gränssnitt, virtuell maskindiskfil eller en enhet.
Termen används främst i rapportering. För mer information, se Använda avancerade rapporter.
Gruppering Copied
Groupings are slices of data collected by a particular attribute. Each attribute forms a single grouping and is drawn as a ring on your . All rings are concentric, with the centre circle forming its own grouping. Groupings can represent any entity that you wish to monitor in your IT infrastructure, such as physical servers, hosts, clusters, applications, server types, tiers, VM state, and so on.
Default grouping values are automatically uploaded from your Capacity Planner chosen monitoring tool. For example, vCenter and Geneos have tags and attributes, respectively. These are automatically brought into Capacity Planner
Configuring Baseline View using grouping values provides you with the ability to view the summary data for the baseline in a number of ways depending on your business needs. For example, you can arrange the groupings in the Baseline View to view the data by application, by component, or by environment. Adding more groupings to the Baseline View creates a sophisticated view of exactly how your VMs are being tasked across your IT infrastructure to help you make more informed decisions about your business.
För mer information om att lägga till, ta bort och omarrangera grupperingar, se Grupperingar.
Utrymme för tillväxt Copied
Headroom indicates the number of reference VMs that can fit into a server or cluster before running into some capacity constraint. The headroom is based on the currently selected reference VM and host.
För mer information, se Utrymme för tillväxt.
Percentil Copied
The percentile figure is the measure defining the amount of time a metric was at a particular value over the course of the baseline used in the scenario. For example, if you pick the 99th percentile for CPU right-sizing, it means that the value used for CPU is the value which the metric has spent 1% of its time at or above over the period of time of the baseline.
Referensvärd Copied
Referensvärden är den vanligaste typen av server du har i din miljö. Att använda ett referensvärd innebär att VM:er ritas i solfjädern i förhållande till en särskild server.
För mer information, se Benchmarking.
Referensarbetsbelastning Copied
The Baseline View lets you set a reference host or reference workload. By setting a reference you can better understand your demand profile across your IT infrastructure. The reference workload and host are used for headroom calculations. Changing your reference host or workload, rather than using a calculated average, may mean you get a more accurate view of your IT infrastructure.
För mer information, se Referensarbetsbelastning .
Rapporter Copied
Reports are a very powerful and flexible feature of . Among other features, they allow you to:
- Summarise utilisation over any time period that has been modelled for a group of entities.
- Create RAG reports indicating where any breaches may have occurred.
- Analyse relationships between metrics and check how many inactive VMs you have.
- Report on cost trends and recommendations for your cloud environment.
Most reports also provide a drill-through capability to view data at successively lower levels of granularity. They can be run against different entity types (for example, physical servers, virtual machines, or hosts). Reports have configurable parameters to provide maximum flexibility, they can be saved and shared.
För mer information, se Använda avancerade rapporter.
Rätt storlek Copied
Forward Thinking scenario modelling helps you rationalise your IT infrastructure by automatically optimising the vCPU allocation across all workloads under a host or another segment. When you migrate workloads, you get an option to right-size servers after this migration operation is executed. We recommend that you do as this ensures that the VMs created are sized accordingly based on the capabilities of the target hardware platform.
För mer information, se Rätt storlek
Solfjädervy Copied
The sunburst is the central part of the screen where your Baseline View or Forward Thinking scenario is visualised.
Graphically, the sunburst is divided into the following elements:
- Rings — represent groupings and can be rearranged.
- Segments — rings are divided into segments, each segment represents a grouping value.
- Centre circle — a segment of its own, with details that can be viewed just like any other segment.
- Small circles around the sunburst — represent your workloads.
Colours of the elements on the sunburst carry particular meaning . For more information, see Sunburst Colours.
För mer information om betydelsen av ringar och segment, se Solfjäder i applikationsgränssnittet
Tidsfjädervy Copied
The timeburst is the central part of the screen where your is visualised. You can switch from the sunburst to the timeburst view using the View menu in the application menu bar or by right-clicking a segment in the sunburst and selecting Show timeburst view.
The timeburst provides a time dimension version to the sunburst. In the sunburst, all machines or instances are represented in the same way regardless of how long they have been running. For example, there is no difference in the representation of a machine that ran for an hour and one that ran 24/7, or when machines were active and when these were not.
In the timeburst, you can find daily patterns and visualise application behaviour. You can observe the activity levels of all your workloads based on which you can see that potential savings could be made if, for example, idle machines are switched off. For more information about potential savings and cloud optimisation options, see Recommend.
För mer information, se Tidsfjädergränssnittet