User interface
Opsview simplifies your daily tasks, from adding new hosts and monitoring dashboards to analyzing alerts and configuring checks.
For easy navigation, the interface is divided into three main sections:
- Monitoring
- Configuration
- Help
You can also access your bookmarked pages from dedicated sections:
- My Links
- Most Used
- User related options
Logging in to Opsview Copied
To start monitoring with Opsview, log in to the web interface.
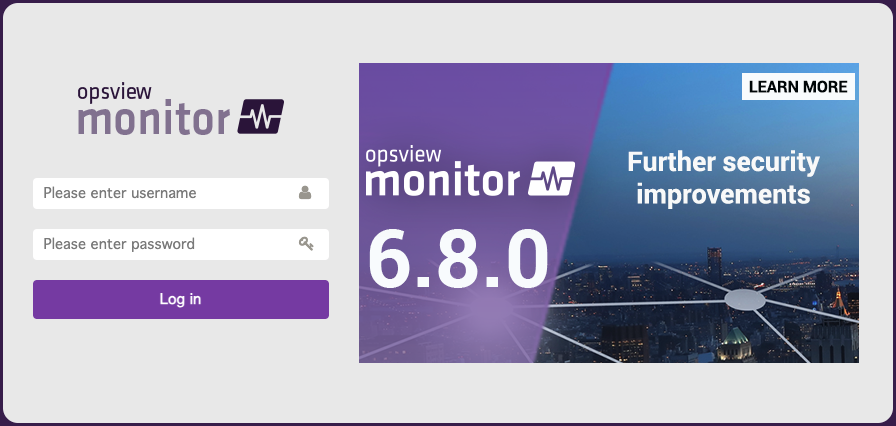
A user logs in based on their username and password combination stored in the configuration database. Alternatively, you can configure Opsview to use LDAP or Active Directory or OAuth2.
For security, Opsview will block any IP address that has more than 50 failed login attempts within an hour. It will also block login by a user that has more than 10 failed login attempts in the last hour. These values can be configured in the Web App.
To ensure a successful login, please review these important notes before proceeding:
- Upon login, the button will change to a spinner and remain so until the page reloads, displaying the user’s home page.
- If the user leaves the page open for more than an hour, the page will automatically reload.
- If you see an error message, it means you’ve reached the maximum number of allowed sessions, which is set by your system administrator (default:
10). This limit includes both UI and REST API sessions.
Monitoring Copied
The Monitoring section provides a central hub for visualizing and interpreting Opsview data. The available options may vary depending on your user permissions.
Click Continue to start the interactive demo below.
| Section | Description |
|---|---|
| Dashboards | Simply drag and drop data tiles or Dashlets to create a view that focuses on what’s important to you. See data from Hashtags, Events Viewer, and Navigator, all in one place. |
| Navigator | The Navigator section provides a comprehensive view of the health of all Opsview Monitor Hosts and Service Checks. |
| Hashtags | An analytics section where you can view the health of all objects tagged with specific hashtags. For example, to see if there is anything in Opsview Monitor tagged with ‘#important’ that is not in an OK state. |
| BSM | Business Service Monitoring (BSM) is an analytics section for viewing the health of Business Services and Components, including potential SLA breaches. |
| Problems | This section that displays all Service Checks currently in a non-OK state within the Opsview system. This section also allows filtering, for example, only showing you non-OK and unhandled issues. |
| Events Viewer | By default, the Events Viewer is filtered to display events that have occurred within the past six hours. The Events Viewer is split into two areas that provide the same information in a graph and in a table for ease of use. |
| Graph Center | The Graph Center allows you to visualize the output of Service Checks, provided they contain numerical performance data (“perfdata”). This data can be graphed both within the Investigate mode window of the Service Check and on the Graph Center itself. |
| Notifications | A section providing a historical view of all notifications sent by Opsview. This section will include details on recipients, problems, and delivery methods. |
| Scheduled Downtime | The Scheduled Downtime section allows you to view any active, pending, or historical downtime (maintenance window and period) within the Opsview system. You can also choose to cancel downtime if it has not yet occurred. |
| Reports | Opsview offers a Reporting module (optional for Pro users) that lets you automatically create professional reports for both your internal teams and clients. This module uses JasperReports to format the data collected by Opsview. |
| NetAudit | With NetAudit, a Network Analyzer module, you can compare backups of network device configurations to identify changes. It also provides secure storage for your device configurations. |
Configuration Copied
The Configuration section is where you can add new objects to Opsview and configure various settings and options. For ease of use, this section is divided into four categories. The available options may vary depending on your user permissions.
Objects / Groups Copied
Click Continue to start the interactive demo below.
| Section | Description |
|---|---|
| Host Groups | This feature allows you to configure the hierarchy of Hosts and Host Groups displayed within the Navigator and other screens that show the organization of your hosts. This function allows you to create a hierarchical Host Group, for example: Europe > UK > England > London. Your Hosts (servers, network devices, and others) located in London would be placed at the end node. |
| Hosts | You can manage Hosts by creating new ones, modifying existing ones, and deleting them. Modifying a Host allows you to configure its monitoring by adding Service Checks and associating Host Templates. |
| Service Checks | Allows you to create new Service Checks, such as one based on a new Monitoring Plugin, an SNMP Polling check, or a new SNMP Trap check. You can add it to Host Templates and Service Groups. |
| BSM | Allows you to create Business Components and Services, and set up the resilience of each component, along with other related options. |
| Hashtags | Allows you to create hashtags and configure their visibility settings. For example, you can specify if it’s visible within Monitoring > Hashtags, set it to Public, or choose other options. |
| Host Templates | This feature allows you to create, modify, and delete Host Templates. These templates can then be applied to Hosts, streamlining configuration. |
| Service Groups | This feature allows you to create Service Groups and allocate Service Checks to these groups. These groups are then used for various functions, such as Access Control and Notifications. |
Advanced Copied
- Autodiscovery — allows you to discover devices on the network in an automated way and add them to Opsview Monitor. There is also the option to discover VMware hosts and Windows active directories and then subsequently discover the Guest machines running on them.
- Host Check Commands — allows you to create, modify and delete Host Check Commands. Unlike Service Checks, Host Check Commands are used to determine the Host Status, i.e. is the Host UP, DOWN or UNREACHABLE.
- Monitoring Plugins — allows you to import plugins, whether they are officially supported Opspacks or third-party nagios compatible plugins. You can also remove a plugin if it is no longer in use in Opsview Monitor.
- SNMP Traps — allows you to configure settings relating to SNMP Traps.
- Variables — allows you to create and define new variables that can then be used when configuring objects such as Service Checks and Hosts.
- Time Periods — allows you to create, modify and delete Time Periods, that can then be used within Notification Profiles or Host settings to determine when a Host or Service Check is being actively monitored, or when notifications should be sent.
- Flow Collectors — allows you to add new Flow Collectors and Flow Sources to be monitored. This menu is visible if you have purchased and installed the Network Analyzer module.
Users and Notifications Copied
- Users and Roles — allows you to create, modify, delete Users and assign them to certain Roles. You can also create new custom roles with different set of permissions for the users assigned to that role.
- Notification Profiles — allows you to create, modify and delete of Notification Profiles. As opposed to personal notifications setup at user level, Notification Profiles are shared and therefore used by more than one user.
- Notification Methods — allows for the modification of existing Notification Methods (e.g. adding your username and password to enable push notifications), and also the addition of new, custom-written notification methods which can be then used within Notification Profiles (defined at the ‘User’ level) or Shared Notification Profiles.
System Copied
- Apply Changes — this menu color will change to orange when modifications have been made to your setup but have not been applied yet. Clicking on Apply Changes will take you to a page where you can submit the changes and effectively put them into production.
- My System — allows you to get an overview of your subscriptions and add software keys. You can also check your installed packages and get diagnostic information. My System also allows for the configuration of extra options such as the data retention (ODW), control over system-wide notifications or NetAudit email address.
- Audit Log — allows you to see what has changed on your Opsview Monitor system setup, who carried the changes and when. It also allows for restoring your system to a previous point should some recent modifications not be adequate.
- Collector Management — allows you to manage new Clusters and Collectors which can be used for monitoring Hosts and Service Checks on remote data centers, etc.
- Multi-Tenancy — allows you to manage Tenancies. For more information, please see Multi-Tenancy.
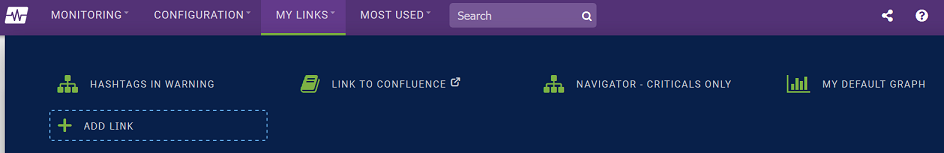
My Links Copied
The My Links section of the user interface is where you can add custom links to your Opsview Monitor system. These links can either be external links to Opsview, or you favorite saved Monitoring views from within Opsview Monitor.
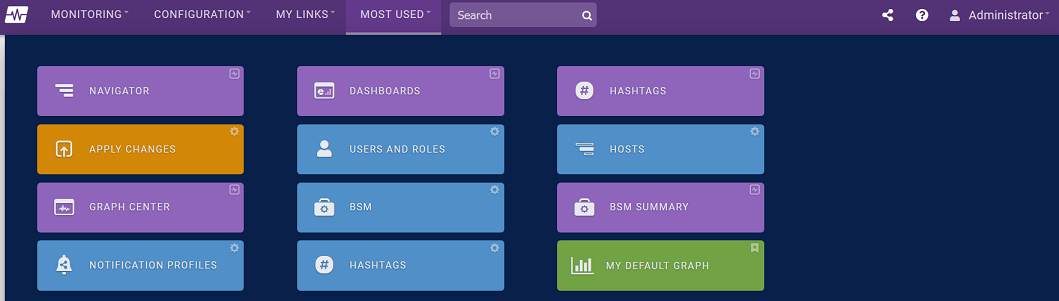
Most used Copied
This section will display your 12 most-used areas of Opsview Monitor. This list is non-editable and is computer-generated based on the clicks per tile. This list will therefore vary from one use to another.
Help Copied
The Help section provides access to external useful resources. Depending on your permissions level, you may or may not see all the below options:
- Documentation — allows you to reach Opsview Monitor Knowledge Center.
- Videos and Tutorials: allows you to reach the Videos section of Opsview.com, containing guides on how to use the software and other supporting materials.
- Opsview Training — allows you to reach the Training Courses available on Opsview.com.
- Opsview Support — allows you to reach Opsview’s Customer Success portal.
- Integrations — allows you to access all the Opspacks available on Opsview.com.
- About Opsview — allows you to reach the About Us section of Opsview.com.
- Forums — allows you to reach the Opsview Forums.
User related options Copied
At the top-right of the navigation bar, you can click on your username. Clicking on it will provide with the below options. If you are logged in as a guest user you not be able to switch users.
- My Profiles — allows you to configure settings that are unique to your own user profile. For more information, see My Profile.
- Switch User — allows you to change the account for the current page by taking you to the login page to re-authenticate and redirecting you back.
- Logout — allows you to exit the application safely.
Automatic Refresh Buttons Copied
Some refresh buttons have a countdown and can perform an automatic data refresh. To view the most recent countdown, hover over the refresh button.
You can right-click to get a menu to stop, restart, or enter a different countdown interval. The new value will be retained when the page is reloaded. If you set the value to be an empty string, then the default value for the button will be used.