Statistical summaries
Overview Copied
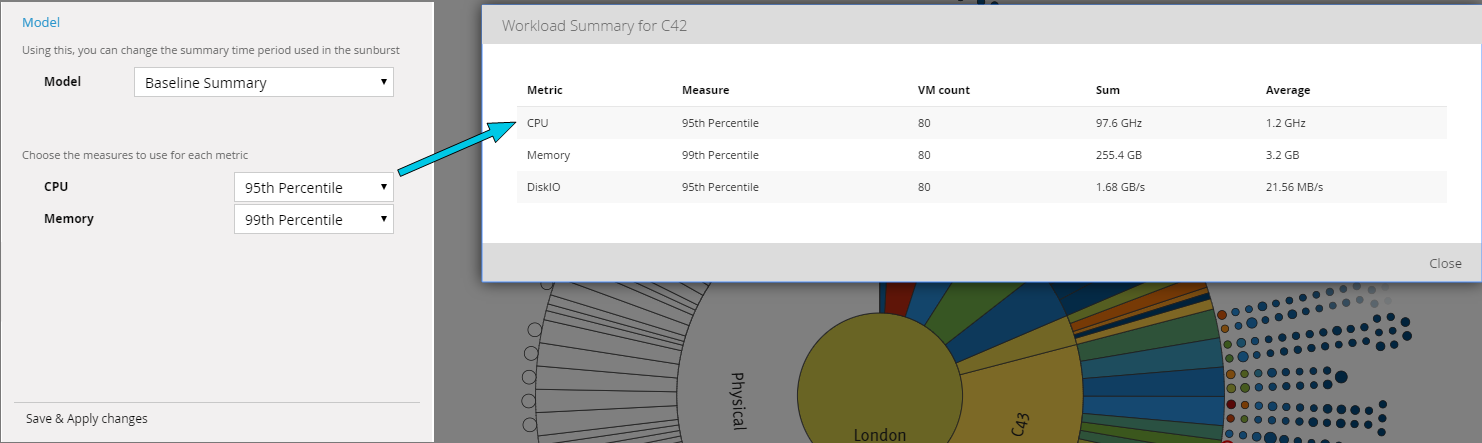
In the Model panel you can view and change the statistical measures for metrics that are used to drive the sunburst headroom calculations (for example the CPU 95th percentile), and the period of time to represent as a statistical summary in the model. A summary is a collection of statistical measures for a subset of the date range used to generate your baseline model. For example, if you are viewing a summary for a given month or day, and you are viewing the 95th percentile values, the percentile is generated using only data for that summary. Thanks to this, data in the baseline is not reprocessed every time you want to change your time frame. You just apply a different summary and the sunburst changes to show that model only.
Note
The purpose of changing models and summary measures is for baseline reporting and data exploration. Forward Thinking scenarios use a mechanism trained on the default metric measures. If you try to create a new model using a Baseline View with non-default metric measures, those measures revert to the defaults when the scenario is created.
Models can be configured and created on a daily basis. To do this, please contact your account representative.
For more information about disambiguation between baseline view, baseline summary, and a model, see Basic concepts in Understand Basic Concepts.
Apply a different summary to the model Copied
Every project has a default baseline view that presents statistical summaries of all data in a 84 day or 12 week rolling window. Within that model there are a number of summaries. By default, there are three summaries:
- Baseline Summary — a single collection of statistical measures for every entity and metric covering the entire duration of the baseline. This is used by default.
- Monthly Summary — a collection of statistical measures for every entity and metric per calendar month that is covered by the baseline time period.
- Daily Summary — a collection of statistical measures for every entity and metric per day that is covered by the baseline time period.
If you require other models, please contact your account representative.
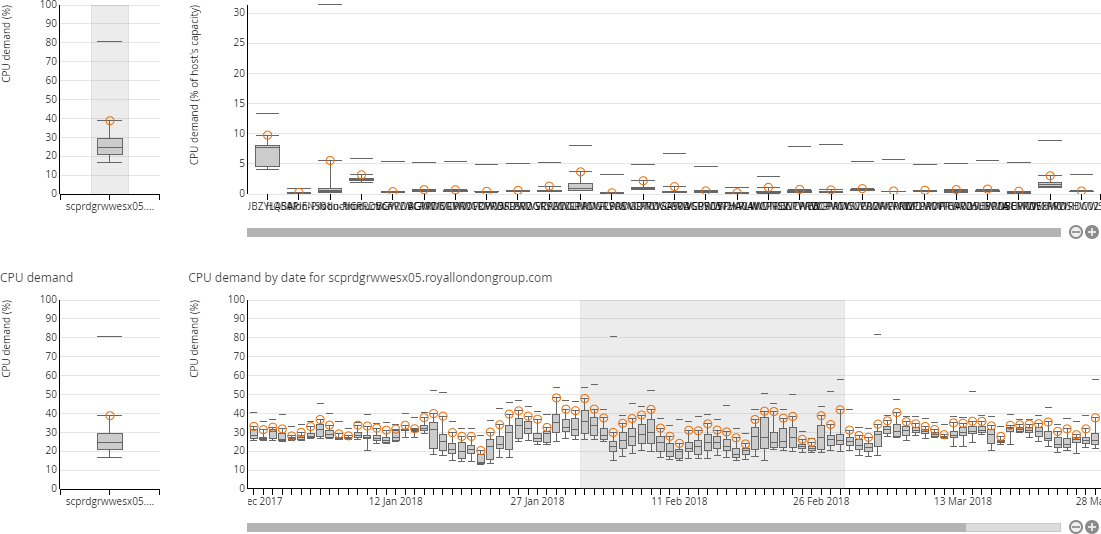
When a model is selected, all time series and box plot charts are updated to indicate what time range is being included in the model. The following example is a drill-through launched from a model that is configured to show the summary of calendar month of February 2018. The segment highlighted on the chart shows the dates included in the model.
What is a summary Copied
In the default baseline, each metric has a summary that uses all data within the scope of that baseline. It is a collection of statistical measures and percentiles based on this data.
For example, if a default baseline runs from January 1 to April 1, each metric is summarised using all data in that time period. If you look at the CPU demand for a workload in this default baseline, the summary that is shown is the 95th percentile of demand over the time period of the whole baseline.
Apply different measures for each metric Copied
You can decide what measures are applied to your metrics. For example, if you select a daily model of 19 April 2018 and then a CPU measure of Maximum, the sunburst calculates available headroom using the peak CPU of every workload and host or server on the 19 April 2018. By default, the 95th percentile is used for CPU and 99th percentile is used for memory.
When you change the measures for the selected model and save your changes, the sunburst is regenerated to display new calculations for that model only.