What's new in ITRS
Discover the latest features and improvements for ITRS products
Geneos: Advanced analytics, forecasting, and data storage through the ITRS Analytics component

Geneos now includes data storage and analytics capabilities that provide intelligence to deliver end-to-end observability across an enterprise. Alongside the Gateways, ITRS Analytics is now a core part of Geneos.

With ITRS Analytics apps, you can enjoy better anomaly detection, noise reduction for large-scale monitoring, and deeper root cause analysis through a user-friendly, web-based interface.

The connection with Gateways, for example, allows running commands directly on entities and metrics within the ITRS Analytics Entity Viewer app, ensuring seamless access and instant history.

Immediate command execution in the ITRS Analytics Entity Viewer app

The ITRS Analytics Entity Viewer app now offers additional command functions. Through the Commands page, commands set up in the Geneos Gateway Setup Editor can be accessed right in the Entity Viewer app, allowing you to run commands at once on entities and metrics.

Easily track the progress of your commands and check which are queued, running, or completed. Access your command history and dive into detailed information about each execution, including dimensions, targets, status, timestamp, and more.

Capacity Planner: AWS summary dashboard

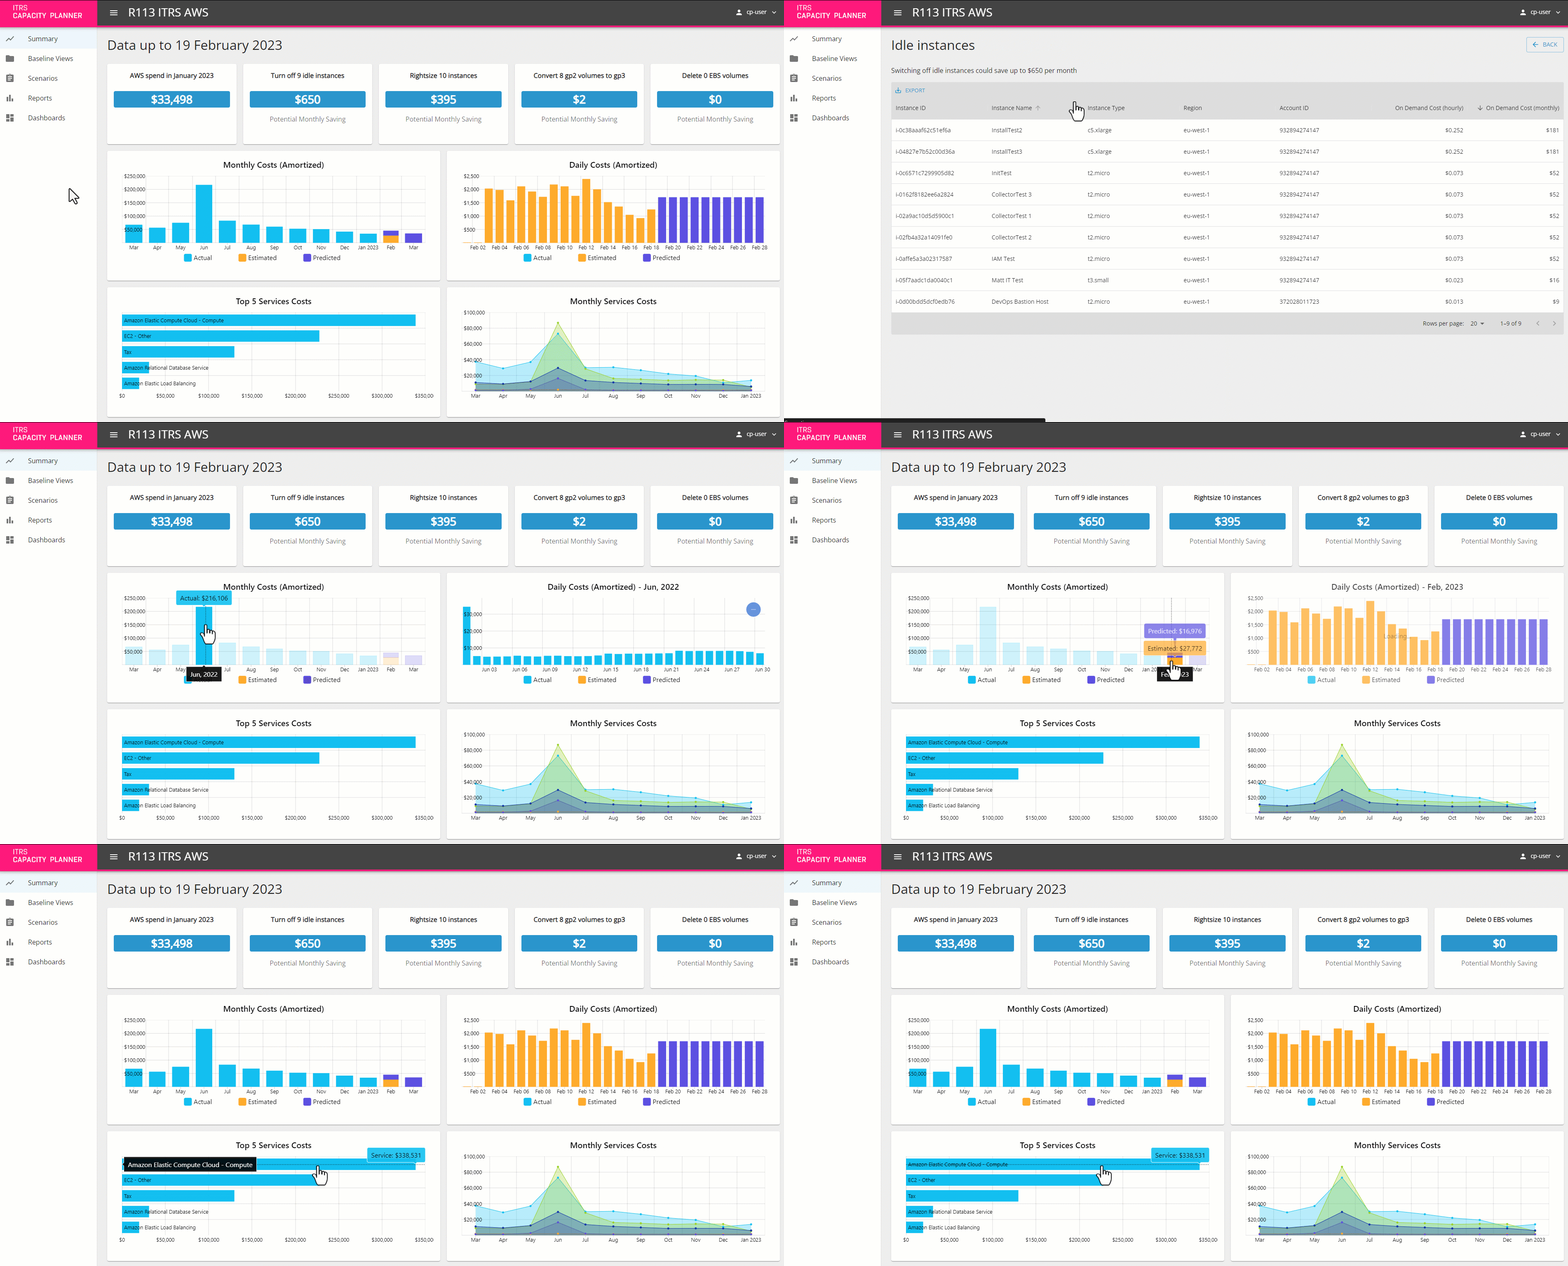
The AWS visual summary dashboard displays key information about the AWS state.

When you log in to Capacity Planner, you can immediately see the total AWS spend in the last full calendar month, the recommendations on how you can save money by turning off idle instances, for right-sizing or removing EBS volumes.

Monthly costs chart displays your month by month breakdown of spend across AWS as well as the estimated spend and the predicted spend for the following month.

In the Services Costs chart you can see a breakdown of cost by the services that you are using.

This dashboard can be enabled if you are using an AWS solution.

OP5 Monitor: Hybrid IT environments

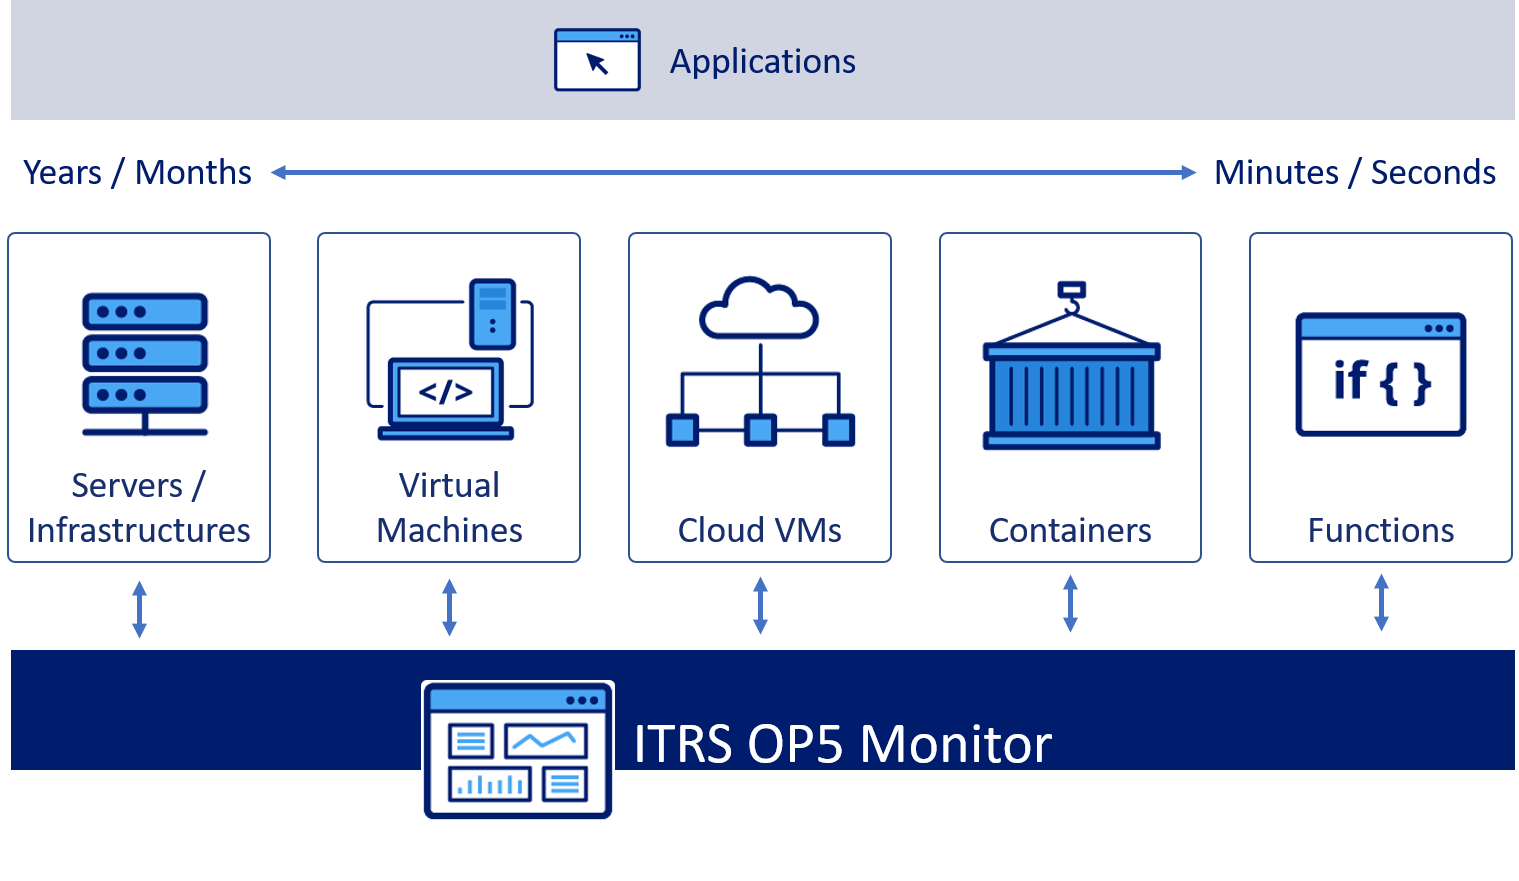
Many of our customers have started to incorporate cloud into their IT estate. This is a natural evolution, and OP5 Monitor shall continue to be a best-in-class monitoring tool for networks and on-premise environments, while evolving to support dynamic environments. We call the mix between traditional IT and dynamic environments the Hybrid IT. We have already started the work of supporting Hybrid IT environments with these new items:

  • We have created the Slim Poller, a containerised lightweight version of OP5 Monitor poller configuration. This was especially designed to enable the OP5 Monitor poller to run as a container in environments such as OpenShift and Kubernetes. Slim Poller supports autoscaling in Kubernetes, can be set up automatically with environment variables, and can auto-register with the cluster.
  • We have created a plugin specifically for monitoring Amazon Web Services (AWS) resources. The plugin allows for this by accessing the AWS native cloud monitoring called CloudWatch.
  • We have created a plugin for monitoring of Kubernetes cluster components such as deployments (replicas), nodes, and pods.
  • We have the latest version of OP5 Monitor available in AWS and Azure Marketplace for easy deployment in the cloud.
  • The check_vmware_v2 plugin replaces the check_vmware_api plugin to bring extended capabilities for monitoring VMware networks.
Opsview: Enhanced Collector Management

With Opsview Deploy, you can customize Dynamic Thresholds by providing configuration parameters such as calculation methods and multipliers. The latest aggregate metrics and performance data from ITRS Analytics are integrated into Opsview. Within the Dynamic Thresholds Configuration UI, you can manage thresholds for specific host-services.

Conveniently view alerts, investigate issues, and modify threshold configurations. The Opsview backend processes data, calculating and applying dynamic thresholds to monitor system performance, while plugins extend Opsview's capabilities in facilitating data collection and alert generation.

["Geneos"] ["User Guide"]